
Key Features of AWS X-Ray
AWS X-Ray is a powerful diagnostic tool that enables developers to identify performance bottlenecks and troubleshoot issues in distributed applications. Its key features include the ability to trace requests through distributed architectures, analyze performance issues, and visualize service maps. With X-Ray, developers can quickly identify problematic services, functions, or endpoints that are causing performance issues, making it an essential tool for optimizing application performance.
One of the critical features of AWS X-Ray is its ability to trace requests through distributed architectures. X-Ray can track requests as they traverse multiple services, allowing developers to identify where requests are taking the most time and resources. This feature is particularly useful in microservices architectures, where requests often pass through multiple services before reaching the end-user.
Another important feature of X-Ray is its ability to analyze performance issues. X-Ray can identify slow services, functions, or endpoints, allowing developers to optimize their code and infrastructure for better performance. X-Ray can also help developers identify and troubleshoot errors, exceptions, and other issues that may be affecting application performance.
In addition to tracing requests and analyzing performance issues, AWS X-Ray can also visualize service maps. Service maps provide a graphical representation of the relationships between services, functions, and endpoints in an application. With service maps, developers can quickly identify which services are communicating with each other and how they are interacting. This feature is particularly useful for debugging complex distributed applications, where identifying the relationships between services can be challenging.
Finally, AWS X-Ray integrates with other AWS services, such as Lambda, API Gateway, and EC2. This integration allows developers to use X-Ray with the tools and services they already use, making it easy to incorporate X-Ray into their existing workflows. By integrating with other AWS services, X-Ray can provide a more comprehensive view of application performance, enabling developers to optimize their applications for better performance and user experience.

How to Use AWS X-Ray: A Step-by-Step Guide
To use AWS X-Ray, you need to create an X-Ray group and enable X-Ray tracing for your application. Here’s a step-by-step guide on how to do this:
- Create an IAM role with the necessary permissions for X-Ray. You can use the X-Ray console, AWS CLI, or AWS SDKs to create the role.
- Create an X-Ray group. An X-Ray group is a collection of traces that share the same sampling rules and permissions. You can create a group using the X-Ray console, AWS CLI, or AWS SDKs.
- Enable X-Ray tracing for your application. You can enable tracing for your application using the X-Ray SDKs, which are available for several programming languages, including Java, Node.js, and Python.
- Analyze the results. Once you have enabled tracing, X-Ray starts collecting data about your application’s performance. You can view this data using the X-Ray console, where you can see service maps, traces, and other performance metrics.
Before using AWS X-Ray, make sure you have the necessary prerequisites and requirements. You need to have an AWS account, and you need to enable X-Ray in the AWS region where your application is running. You also need to install the X-Ray SDK for your programming language and configure it with the necessary settings.
When using AWS X-Ray, keep in mind some best practices. Set up appropriate sampling rules to ensure that X-Ray only collects the data you need. Configure appropriate permissions to ensure that only authorized users can access your X-Ray data. Integrate X-Ray with other monitoring and logging tools to get a more comprehensive view of your application’s performance.
Avoid common pitfalls and mistakes when using X-Ray. Make sure you have enough sampling rates to get meaningful data. Be aware of the potential performance impact of X-Ray on your application. Use X-Ray’s filtering and grouping features to analyze your data effectively.
Benefits of Using AWS X-Ray
AWS X-Ray offers several benefits for developers looking to optimize their application performance and troubleshoot issues. Here are some of the key benefits of using AWS X-Ray:
- Improved application performance: By using AWS X-Ray, developers can quickly identify and resolve performance bottlenecks in their applications. X-Ray provides detailed insights into application behavior, enabling developers to optimize their code and infrastructure for better performance.
- Reduced debugging time: AWS X-Ray can significantly reduce debugging time by providing detailed trace data for requests as they traverse distributed architectures. With X-Ray, developers can quickly identify and troubleshoot issues, reducing the time it takes to resolve bugs and errors.
- Enhanced user experience: By optimizing application performance and reducing debugging time, AWS X-Ray can help developers deliver a better user experience. X-Ray enables developers to identify and resolve issues that may be affecting user experience, such as slow response times or errors.
- Optimized resource utilization: AWS X-Ray can help developers optimize their applications’ resource utilization by identifying services or functions that are consuming excessive resources. By optimizing resource utilization, developers can reduce costs and improve application performance.
AWS X-Ray is an essential tool for developers looking to optimize their application performance and troubleshoot issues in microservices architectures. By providing detailed insights into application behavior, X-Ray enables developers to quickly identify and resolve performance bottlenecks, reduce debugging time, and enhance user experience.

Real-World Applications of AWS X-Ray
AWS X-Ray is used by many companies in various industries to optimize their applications’ performance and troubleshoot issues. Here are some examples of real-world applications of AWS X-Ray:
- Media and entertainment: Media and entertainment companies use AWS X-Ray to analyze the performance of their video streaming applications. By using X-Ray, they can identify and resolve performance bottlenecks, ensuring a high-quality viewing experience for their users.
- Financial services: Financial services companies use AWS X-Ray to monitor the performance of their trading platforms. By using X-Ray, they can quickly identify and resolve issues that may affect their users’ ability to execute trades, reducing the risk of financial losses.
- E-commerce: E-commerce companies use AWS X-Ray to monitor the performance of their online stores. By using X-Ray, they can quickly identify and resolve issues that may affect their users’ ability to complete purchases, improving their conversion rates and revenue.
- Gaming: Gaming companies use AWS X-Ray to analyze the performance of their online games. By using X-Ray, they can identify and resolve performance bottlenecks, ensuring a smooth and enjoyable gaming experience for their users.
Here are some testimonials and case studies from companies that use AWS X-Ray:
- Netflix: According to Netflix, AWS X-Ray has helped them reduce debugging time by up to 80%. By using X-Ray, they can quickly identify and troubleshoot issues in their complex microservices architecture.
- Expedia: Expedia uses AWS X-Ray to monitor the performance of their travel booking platform. By using X-Ray, they have been able to reduce mean time to resolution (MTTR) for performance issues by up to 75%.
- Finra: Finra uses AWS X-Ray to monitor the performance of their financial regulatory platform. By using X-Ray, they have been able to improve application performance by up to 30% and reduce debugging time by up to 50%.
These examples and testimonials demonstrate the real-world value of AWS X-Ray for optimizing application performance and troubleshooting issues in complex microservices architectures.

Best Practices for Using AWS X-Ray
To get the most out of AWS X-Ray, it’s essential to follow some best practices. Here are some tips for using X-Ray effectively:
- Set up appropriate sampling rules: X-Ray uses sampling to determine which requests to trace. It’s essential to set up appropriate sampling rules to ensure that X-Ray collects enough data to be useful while minimizing the impact on application performance. You can configure sampling rules using the X-Ray console, AWS CLI, or AWS SDKs.
- Configure appropriate permissions: X-Ray uses IAM roles and policies to control access to X-Ray data. It’s essential to configure appropriate permissions to ensure that only authorized users can access X-Ray data. You can use the X-Ray console, AWS CLI, or AWS SDKs to configure permissions.
- Integrate X-Ray with other monitoring and logging tools: X-Ray can be integrated with other monitoring and logging tools, such as CloudWatch, to provide a more comprehensive view of application performance. It’s essential to integrate X-Ray with other tools to get the most out of X-Ray and to enable effective troubleshooting and optimization.
- Avoid common pitfalls and mistakes: When using X-Ray, it’s essential to avoid common pitfalls and mistakes, such as enabling X-Ray tracing for all requests, which can impact application performance. It’s also essential to avoid configuring overly aggressive sampling rules, which can result in insufficient data being collected.
By following these best practices, you can ensure that you get the most out of AWS X-Ray and effectively optimize your application’s performance.

Comparing AWS X-Ray with Other Monitoring Tools
When it comes to monitoring application performance, there are several tools available in the market, including AWS X-Ray, New Relic, AppDynamics, and Dynatrace. Here’s a comparison of these tools in terms of features, pricing, and integrations:
- Features: AWS X-Ray provides detailed trace data for requests as they traverse distributed architectures, enabling developers to identify performance bottlenecks and troubleshoot issues. New Relic, AppDynamics, and Dynatrace also provide similar features, but their focus is more on application performance management (APM) rather than distributed tracing. X-Ray’s strength lies in its ability to trace requests through complex microservices architectures.
- Pricing: AWS X-Ray offers a pay-per-use pricing model, where you only pay for the data you use. New Relic, AppDynamics, and Dynatrace offer various pricing plans, including free tiers and subscription-based models. The pricing for these tools can vary based on the number of hosts, applications, and transactions monitored.
- Integrations: AWS X-Ray integrates with other AWS services, such as Lambda, API Gateway, and EC2. New Relic, AppDynamics, and Dynatrace also provide integrations with various cloud platforms and infrastructure tools. X-Ray’s integration with other AWS services makes it an ideal choice for developers who are already using AWS for their infrastructure needs.
When choosing a monitoring tool, it’s essential to consider your specific needs and requirements. If you’re looking for a tool that provides detailed trace data for distributed architectures, AWS X-Ray is an excellent choice. However, if you’re looking for a more comprehensive APM solution, you may want to consider New Relic, AppDynamics, or Dynatrace.
Future Developments and Trends in AWS X-Ray
AWS X-Ray is a constantly evolving service, with new features, integrations, and improvements being added regularly. Here are some future developments and trends to look out for in AWS X-Ray:
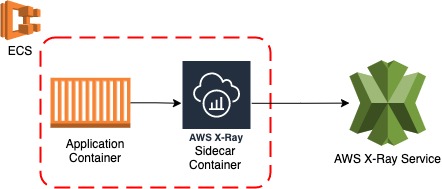
- Integration with more AWS services: AWS X-Ray already integrates with several AWS services, including Lambda, API Gateway, and EC2. However, AWS has announced plans to integrate X-Ray with more services, such as ECS and Fargate, in the future. This will enable developers to trace requests through even more complex architectures and gain deeper insights into their applications’ behavior.
- Support for more programming languages: Currently, AWS X-Ray supports several programming languages, including Java, Node.js, and Python. However, AWS has announced plans to add support for more languages, such as Go and Ruby, in the future. This will enable even more developers to use X-Ray to optimize their applications’ performance.
- Improved performance and scalability: AWS X-Ray is designed to handle high volumes of trace data, but AWS is constantly working to improve its performance and scalability. In the future, we can expect X-Ray to become even more efficient and capable of handling larger workloads.
- Integration with third-party tools: AWS X-Ray already integrates with several third-party tools, such as Datadog and Slack. However, AWS has announced plans to add more integrations in the future. This will enable developers to use X-Ray with even more tools and gain even more insights into their applications’ behavior.
Overall, AWS X-Ray is a powerful tool for optimizing application performance, and its future developments and trends are exciting. By integrating with more AWS services, supporting more programming languages, improving performance and scalability, and integrating with more third-party tools, X-Ray will become even more valuable to developers in the future.
