Introduction to Azure DevOps Dashboards
Azure DevOps is a powerful platform that supports teams throughout the entire software development lifecycle. It offers a wide range of features, including version control, continuous integration/continuous delivery (CI/CD), and project tracking. Among these valuable tools, Azure DevOps dashboards stand out as essential for managing and monitoring development projects effectively.
An Azure DevOps dashboard is a customizable, graphical representation of development data and metrics. It allows teams to visualize essential information, such as work item progress, build statuses, and test results. By using Azure DevOps dashboards, teams can quickly identify trends, potential issues, and areas for improvement. This, in turn, helps them make data-driven decisions and streamline their development workflows.
In this article, we will explore various Azure DevOps dashboard examples, discuss how to create a custom dashboard, and delve into best practices for dashboard design. By the end, you will have a solid understanding of how to leverage Azure DevOps dashboards to optimize your development processes.
Notable Azure DevOps Dashboard Examples
To help you better understand the potential of Azure DevOps dashboards, we have compiled a list of impressive examples. These examples showcase the platform’s capabilities and can inspire you to create your own customized dashboards tailored to your team’s needs.
1. Scrum Board Dashboard
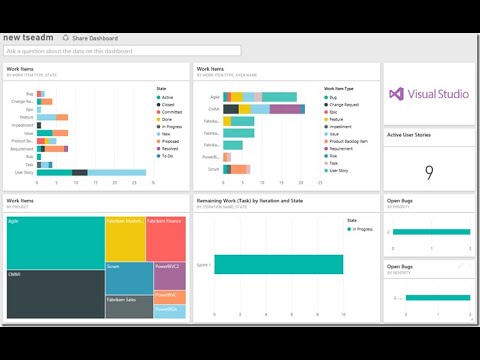
A Scrum board dashboard is perfect for Agile teams following the Scrum framework. It typically includes widgets that display the product backlog, sprint backlog, and current sprint progress. This type of dashboard helps teams visualize their work, track progress, and identify any issues that may require attention.
2. Quality Assurance Dashboard
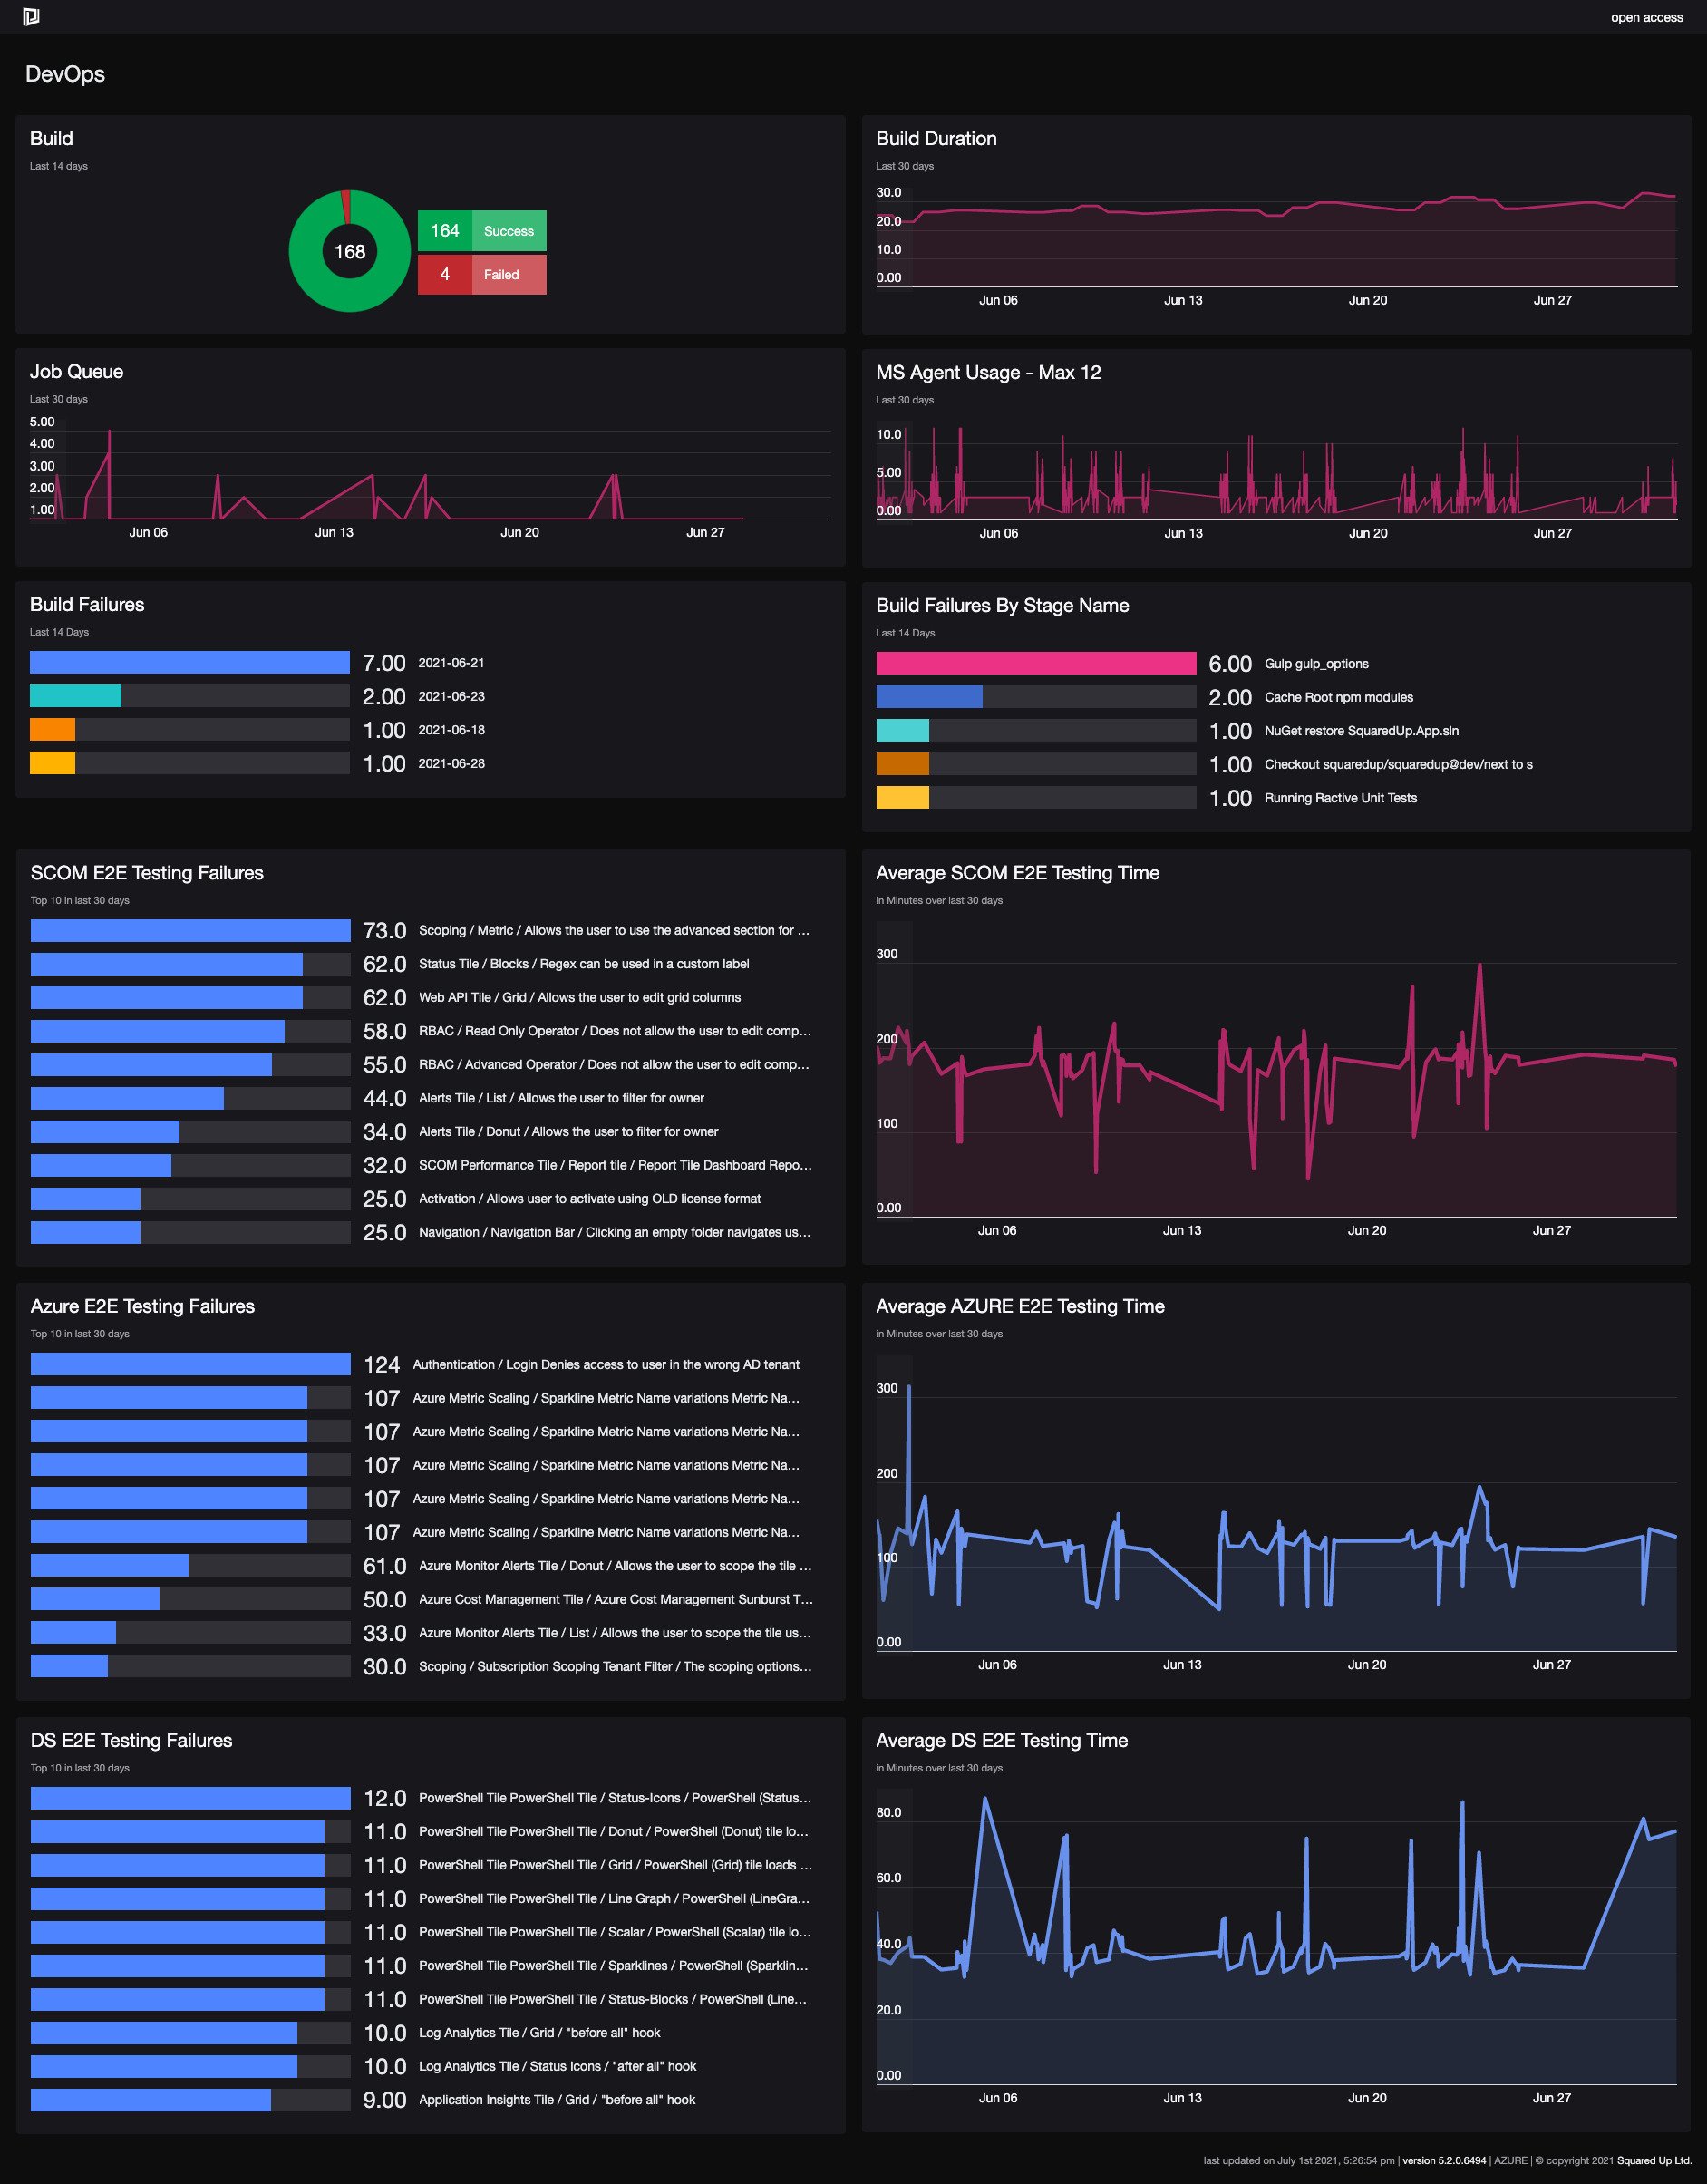
A Quality Assurance dashboard focuses on testing and quality control. It includes widgets that display test results, test runs, and test trends. This dashboard helps teams ensure that their software meets quality standards and identify areas for improvement in the testing process.
3. Release Pipeline Dashboard
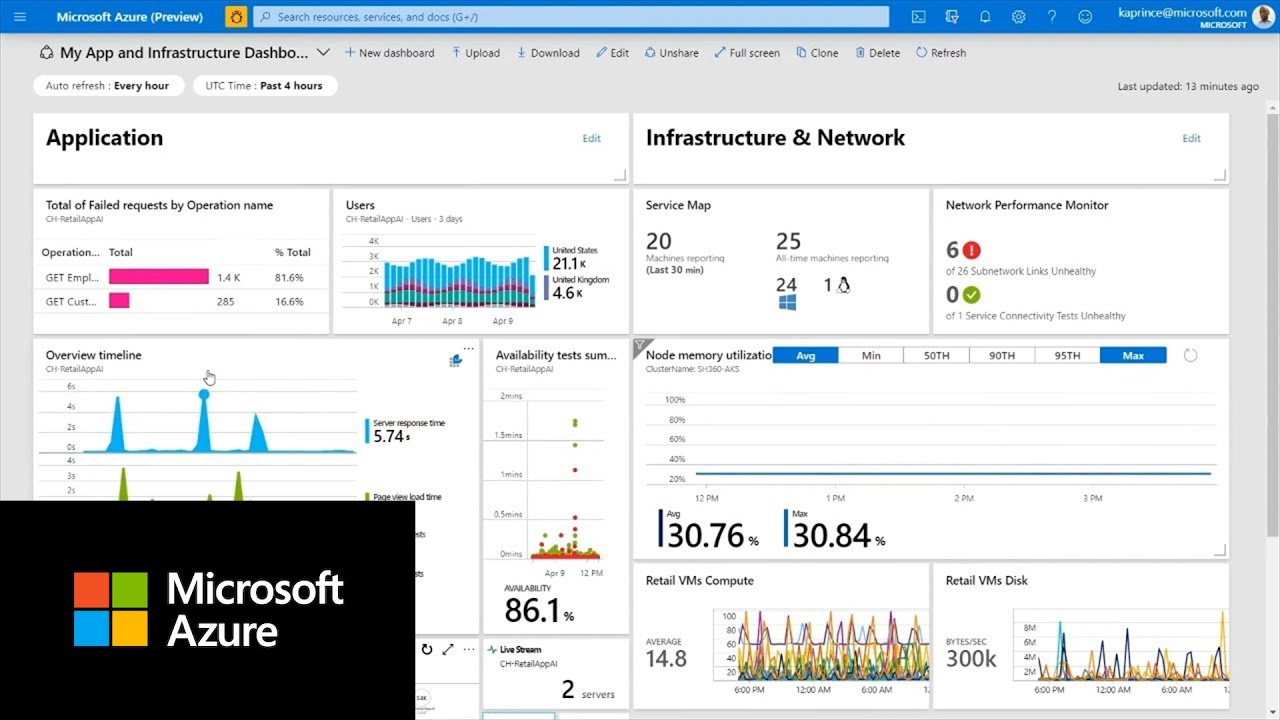
A Release Pipeline dashboard is designed to visualize the CI/CD pipeline, displaying the status of builds, releases, and deployments. This dashboard helps teams monitor the health of their pipelines, identify bottlenecks, and ensure smooth, continuous delivery of software updates.
4. Analytics Dashboard
An Analytics dashboard provides insights into development trends and performance. It includes widgets that display metrics such as lead time, cycle time, and throughput. This dashboard helps teams understand their development patterns, identify inefficiencies, and make data-driven decisions to optimize their workflows.
How to Create a Custom Azure DevOps Dashboard
Creating a custom Azure DevOps dashboard is a straightforward process that allows you to tailor your development insights to your team’s needs. Follow these steps to create a new dashboard and select the widgets that best suit your project:
-
Navigate to the Dashboards section: In Azure DevOps, open the project you want to create the dashboard for, and then click on the “Boards” > “Dashboards” menu option.
-
Create a new dashboard: Click on the “New dashboard” button, choose a name for your dashboard, and select the desired permissions (e.g., private, public, or role-based). Then, click “Create” to proceed.
-
Add widgets to your dashboard: Click on the “Add widget” button, and you will be presented with a list of available widgets. Choose a widget that aligns with your monitoring goals, and click “Add” to add it to your dashboard.
-
Configure and arrange widgets: Once you have added a widget, you can configure it by clicking on the “Configure” button. Customize the widget settings to display the data you want to monitor. You can also rearrange widgets by dragging and dropping them to your desired location on the dashboard.
-
Save your dashboard: After adding and configuring your widgets, click on the “Save” button to save your dashboard. It will now be accessible from the “Dashboards” menu in Azure DevOps.
When selecting widgets for your custom Azure DevOps dashboard, consider the following recommendations:
-
Choose widgets that display relevant data for your team’s development processes.
-
Limit the number of widgets on your dashboard to avoid overwhelming users with information.
-
Arrange widgets logically, grouping related information together and ensuring that the most important data is prominently displayed.
-
Regularly review and update your dashboard to ensure it remains relevant and useful to your team.
- Product Backlog: A widget that displays the complete list of product backlog items, prioritized based on their business value.
- Sprint Backlog: A widget that shows the items selected for the current sprint, along with their status and progress.
- Sprint Burndown Chart: A widget that visualizes the team’s progress in completing sprint tasks, helping them identify whether they are on track to meet the sprint goal.
- Work Item Board: A widget that shows the current status of work items, grouped by their process stages.
- Cumulative Flow Diagram: A widget that visualizes the flow of work items through the development process, helping teams identify bottlenecks and optimize their workflows.
- Lead Time and Cycle Time Widgets: Widgets that display the average time it takes for tasks to move through the development process, from start to finish.
- Velocity Chart: A widget that displays the team’s historical velocity, helping them estimate the amount of work they can commit to in future sprints.
- Burn-Up Chart: A widget that visualizes the team’s progress in completing work items throughout the project, helping them track their overall progress.
- Cycle Time Distribution: A widget that shows the distribution of cycle times for completed tasks, helping teams identify opportunities for process improvements.
- Focus on the most relevant data for the team’s development process.
- Limit the number of widgets to avoid overwhelming users with information.
- Arrange widgets logically, grouping related information together and ensuring that the most important data is prominently displayed.
- Regularly review and update the dashboard to ensure it remains relevant and useful to the team.
- Pie Chart: Displays data as slices of a pie, useful for showing proportions or percentages of a whole.
- Bar Chart: Compares data across different categories using horizontal bars, ideal for displaying cumulative data.
- Column Chart: Compares data across different categories using vertical columns, suitable for displaying comparisons or trends.
- Work Items: Displays a list of work items based on a specified query, helpful for tracking tasks and bugs.
- Shared Queries: Displays a list of shared queries, enabling teams to monitor progress on shared goals.
- Velocity: Displays the team’s historical velocity, helping them estimate the amount of work they can commit to in future sprints.
- Lead Time and Cycle Time: Shows the average time it takes for tasks to move through the development process, from start to finish.
- Cumulative Flow Diagram: Visualizes the flow of work items through the development process, helping teams identify bottlenecks and optimize their workflows.
- Build Summary: Shows a summary of build information, including status, duration, and associated changesets.
- Build Quality: Displays the quality of a build, based on associated tests and approvals.
- Test Plans: Shows the status of test plans and associated test cases.
- Test Results: Displays the results of executed tests, including passed, failed, and skipped tests.
- Release Summary: Shows a summary of release information, including stages, environments, and associated changesets.
- Deployment Quality: Displays the quality of a deployment, based on associated tests and approvals.
- Choose widgets that display relevant data for your team’s development processes.
- Limit the number of widgets on your dashboard to avoid overwhelming users with information.
- Arrange widgets logically, grouping related information together and ensuring that the most important data is prominently displayed.
- Regularly review and update your dashboard to ensure it remains relevant and useful to your team.
-
Navigate to the “Boards” > “Dashboards” menu option in Azure DevOps and create a new dashboard or edit an existing one.
-
Click on the “Add widget” button and select the “GitHub Connector” widget from the list.
-
Authenticate with your GitHub account and authorize Azure DevOps to access your repositories, pull requests, and issues.
-
Configure the widget to display the desired data, such as repository activity, pull request status, or issue trends.
-
Navigate to the “Boards” > “Dashboards” menu option in Azure DevOps and create a new dashboard or edit an existing one.
-
Click on the “Add widget” button and select the “Jira Software” widget from the list.
-
Authenticate with your Jira account and authorize Azure DevOps to access your Jira projects, issues, and boards.
-
Configure the widget to display the desired data, such as issue status, sprint progress, or board activity.
- Ensure that the integrated tools align with your team’s development workflows and processes.
- Limit the number of integrated tools to avoid overwhelming users with information.
- Arrange integrated tools logically, grouping related information together and ensuring that the most important data is prominently displayed.
- Regularly review and update your dashboard to ensure it remains relevant and useful to your team.

Effective Dashboard Layouts for Agile Teams
Agile teams require a dashboard layout that supports their iterative and incremental development approach. Here are some suggestions for effective dashboard layouts tailored to Agile teams:
1. Scrum Board Dashboard
A Scrum board dashboard is designed to support Scrum teams by displaying the product backlog, sprint backlog, and current sprint progress. This layout typically includes the following widgets:
2. Kanban Board Dashboard
A Kanban board dashboard is ideal for teams following the Kanban methodology. It displays the work in progress and helps teams visualize the flow of tasks through the development process. This layout typically includes the following widgets:
3. Agile Metrics Dashboard
An Agile Metrics dashboard focuses on essential Agile metrics, such as velocity, burn-up charts, and cycle time. This layout typically includes the following widgets:
When designing an Agile team’s dashboard, consider the following best practices:
Azure DevOps Dashboard Widgets: A Comprehensive Overview
Azure DevOps offers a wide range of widgets that can be added to your dashboard to provide valuable insights and help manage your development projects more effectively. Here is a comprehensive overview of the different types of widgets available and recommendations on which to use in specific scenarios:
1. Chart Widgets
Chart widgets display graphical representations of data, making it easier to understand trends and patterns. Examples include:
2. Query Widgets
Query widgets allow you to create custom queries to display specific data from your Azure DevOps projects. Examples include:
3. Analytics Widgets
Analytics widgets provide insights into development trends and performance. Examples include:
4. Build Widgets
Build widgets display the status and progress of builds in your Azure DevOps projects. Examples include:
5. Test Widgets
Test widgets display the status and results of tests in your Azure DevOps projects. Examples include:
6. Deployment Widgets
Deployment widgets display the status and progress of deployments in your Azure DevOps projects. Examples include:
When designing your Azure DevOps dashboard, consider the following best practices:

Integrating External Tools with Azure DevOps Dashboards
Integrating external tools with Azure DevOps dashboards can help centralize development workflows and data, providing a more comprehensive view of your projects. This section discusses the process of integrating external tools, such as GitHub or Jira, with Azure DevOps dashboards.
1. Integrating GitHub with Azure DevOps
Azure DevOps supports integration with GitHub, allowing you to view and manage GitHub repositories, pull requests, and issues directly from your Azure DevOps dashboard. To integrate GitHub with Azure DevOps, follow these steps:
2. Integrating Jira with Azure DevOps
Azure DevOps also supports integration with Jira, enabling you to view and manage Jira issues, sprints, and boards directly from your Azure DevOps dashboard. To integrate Jira with Azure DevOps, follow these steps:
When integrating external tools with Azure DevOps dashboards, consider the following best practices:
Best Practices for Azure DevOps Dashboard Design
Designing effective Azure DevOps dashboards can significantly improve your team’s productivity and collaboration. Here are some best practices to consider when creating and organizing your dashboard:
1. Keep it Simple and Organized
Avoid cluttering your dashboard with too many widgets. Instead, focus on the most important data and organize it logically. Group related widgets together and use sections to separate different types of information.
2. Choose the Right Color Scheme
Colors can help draw attention to critical information and improve data comprehension. Use contrasting colors for charts and graphs to distinguish between different data points. However, avoid using overly bright or distracting colors that may make the dashboard difficult to read or interpret.
3. Utilize Data Visualization
Use charts, graphs, and other visual elements to represent data in an easy-to-understand format. This can help you quickly identify trends, patterns, and potential issues. For example, use a pie chart to display the distribution of work items by category or a line graph to track changes in build times over time.
4. Optimize for Visibility
Arrange widgets on your dashboard to ensure optimal visibility. Place the most important widgets in prominent locations, such as the top or left side of the dashboard. Also, consider the size and aspect ratio of each widget to ensure it displays data clearly and accurately.
5. Regularly Update and Refine Your Dashboard
As your team’s needs and development processes evolve, so should your dashboard. Regularly review and update your dashboard to ensure it remains relevant and useful. Remove outdated or irrelevant widgets, add new ones as needed, and adjust the layout to accommodate changes in your workflows.
By following these best practices, you can create an Azure DevOps dashboard that effectively monitors and improves your development processes. Remember to keep it simple, organized, and focused on the most important data. Utilize data visualization, optimize for visibility, and regularly update and refine your dashboard to ensure it remains a valuable tool for your team.

Monitoring and Improving Development Processes with Azure DevOps Dashboards
Azure DevOps dashboards offer a powerful way to monitor and improve your development processes. By tracking key performance indicators (KPIs) and metrics, you can identify bottlenecks, optimize workflows, and ensure your team stays on track for successful project delivery.
1. Identify Relevant KPIs and Metrics
Begin by determining which KPIs and metrics are most important for your project. Common examples include lead time, cycle time, throughput, work item age, and build success rate. These metrics can help you understand your team’s efficiency, quality, and overall performance.
2. Add Relevant Widgets to Your Dashboard
Once you’ve identified the KPIs and metrics you want to track, add corresponding widgets to your Azure DevOps dashboard. For example, you might add a chart widget to display lead time trends or a query widget to show work items by age. Ensure that the widgets are properly configured to display the desired data.
3. Regularly Review and Analyze Your Dashboard
To effectively monitor and improve your development processes, regularly review and analyze your Azure DevOps dashboard. Look for trends, patterns, and anomalies in the data, and use this information to identify areas for improvement. For example, if you notice that lead times are increasing, you might investigate potential bottlenecks in your workflow or consider reallocating resources to address the issue.
4. Implement Improvements and Iterate
Based on your analysis, implement improvements to your development processes and iterate on your dashboard. Add, remove, or reconfigure widgets as needed to ensure that your dashboard remains relevant and useful. Continuously monitor your KPIs and metrics to ensure that your team stays on track for success.
By leveraging Azure DevOps dashboards to monitor development processes, identify bottlenecks, and implement improvements, you can foster a culture of continuous growth and success. Regularly reviewing and analyzing your dashboard will help you stay informed about your team’s performance and enable you to make data-driven decisions that drive positive outcomes.