
What is Power BI? A Powerful Business Analytics Tool
Power BI, developed by Microsoft, is a comprehensive business analytics tool designed to transform raw data into interactive, immersive, and intelligent insights. Its primary function is to simplify data preparation and visualization, enabling users to make informed decisions with ease. By connecting to various data sources, Power BI empowers users to gather, analyze, and share valuable information, fostering a data-driven culture within organizations.

Key Features and Capabilities of Power BI
Power BI offers a wide range of features and capabilities that cater to various business needs. One of its primary strengths is its extensive library of data connectors, which enables users to connect to a diverse range of data sources, including Excel, SQL Server, Salesforce, and Google Analytics. By consolidating data from multiple sources, Power BI facilitates a unified and comprehensive view of an organization’s data landscape.
Another key feature of Power BI is its powerful data modeling capabilities. Users can create complex data models, define relationships between tables, and perform advanced data transformations using the built-in data modeling tools. This empowers users to cleanse, shape, and enrich their data, ensuring that the insights generated are accurate, relevant, and actionable.
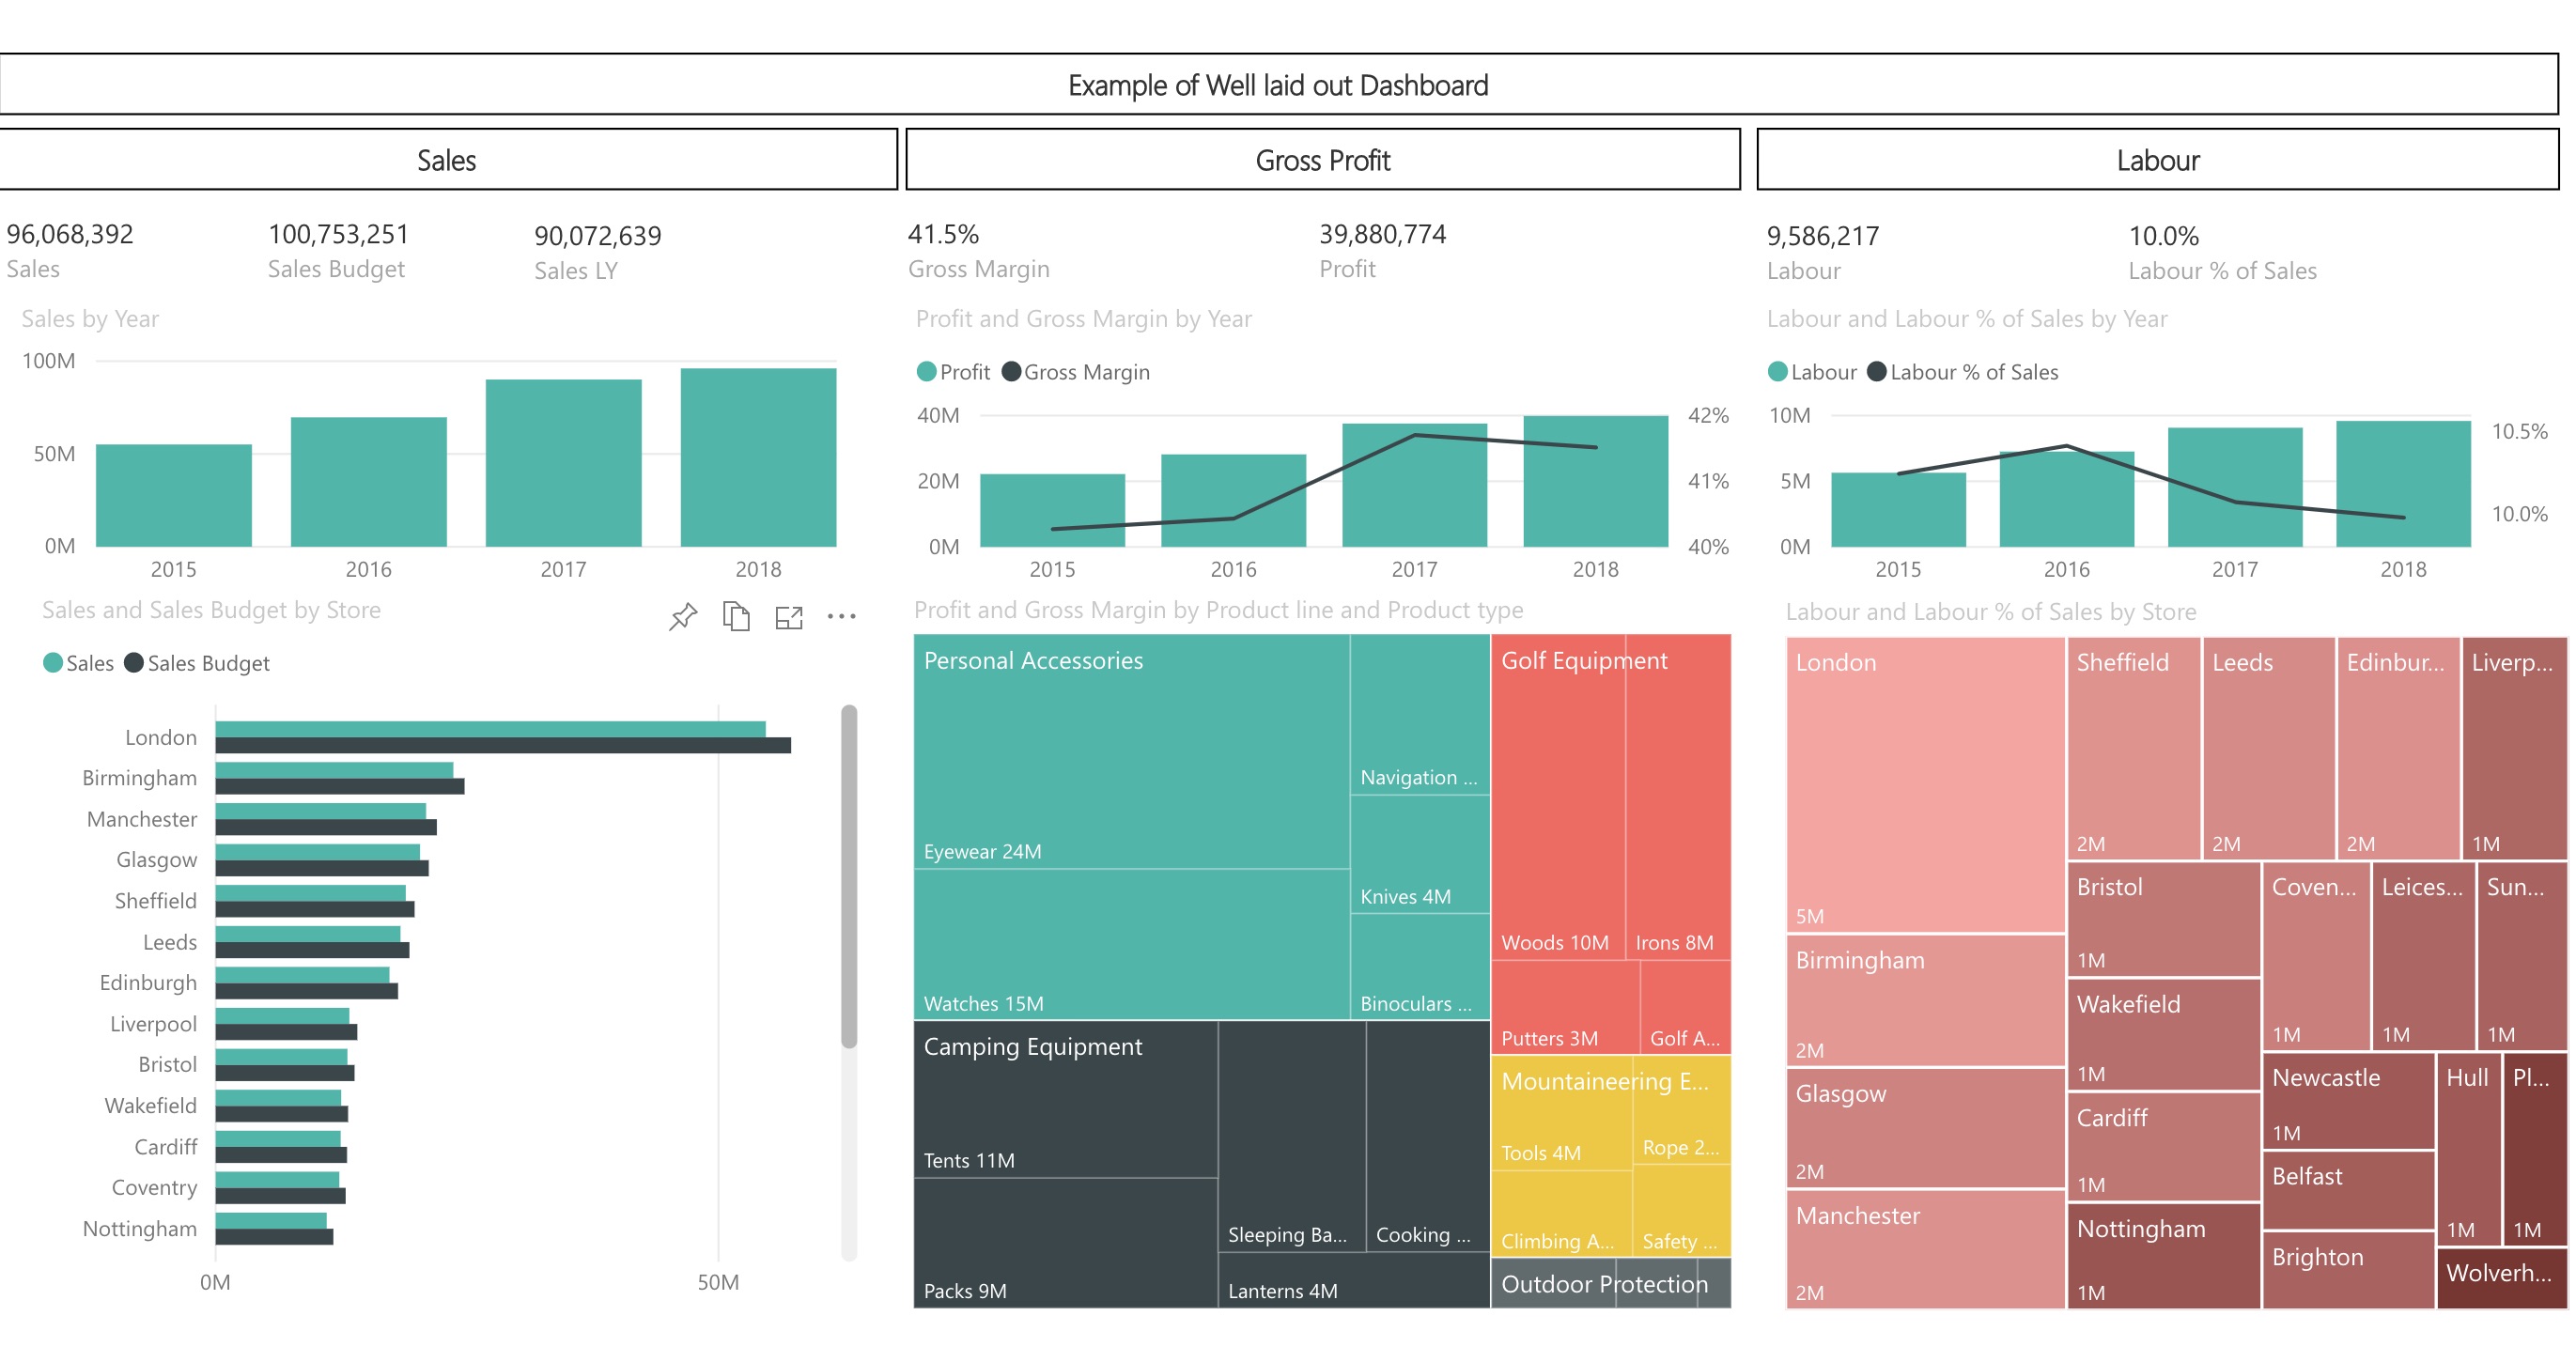
Power BI also offers a wide variety of customizable visualizations that allow users to present their data in engaging and interactive ways. From basic bar charts and line graphs to more advanced visualizations like scatter plots, treemaps, and funnel charts, Power BI provides a rich set of tools for users to represent their data in a manner that best suits their needs. These visualizations can be easily tailored to reflect specific branding guidelines, ensuring a consistent and professional appearance across all reports and dashboards.
By combining these features, Power BI empowers users to create personalized and interactive reports and dashboards that foster data-driven insights and decision-making. Users can easily drill down into their data, uncover trends, and identify areas for improvement, all within a single, easy-to-use platform.
How to Use Power BI: A Step-by-Step Guide
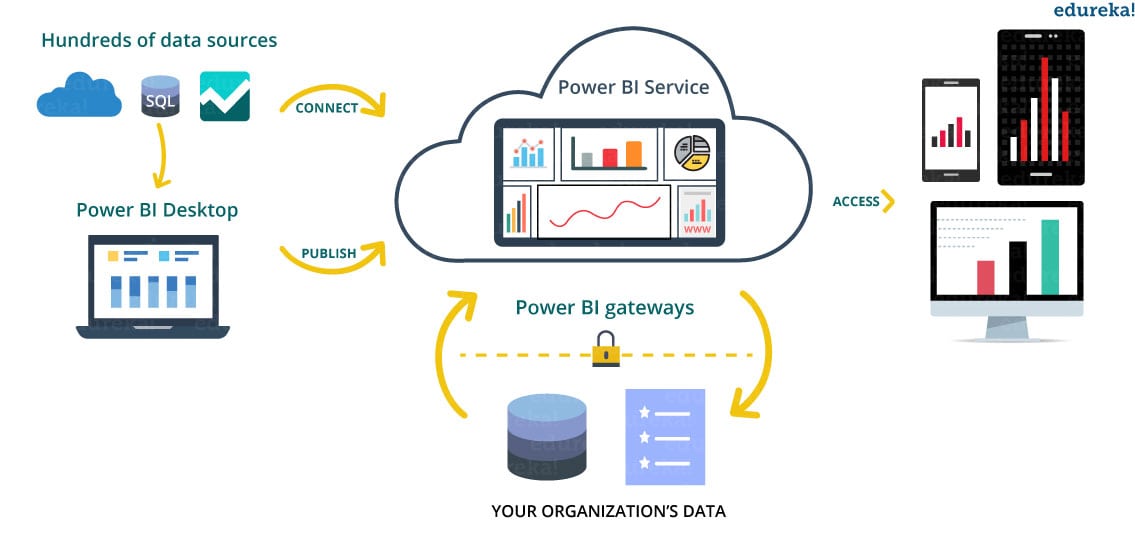
Getting started with Power BI is straightforward and can be broken down into several key steps. First, users should sign up for a Power BI account by visiting the official Microsoft Power BI website. Once registered, users can access the Power BI service and begin exploring its features and capabilities.
To start working with data, users need to connect Power BI to their desired data sources. Power BI supports a wide variety of data sources, including cloud-based services, on-premises databases, and local files. Users can easily establish connections by navigating to the “Get Data” option within the Power BI service and selecting their preferred data source.
After connecting to a data source, users can create reports and visualizations using Power BI’s intuitive interface. The platform offers a range of pre-built visualizations, as well as the ability to create custom visuals tailored to specific needs. Users can also leverage Power BI’s data modeling tools to define relationships between tables, cleanse data, and perform advanced transformations.
Once reports and visualizations are complete, users can share their work with others by publishing their content to the Power BI service. This allows stakeholders to access and interact with the data, fostering collaboration and data-driven decision-making. Users can control access to their content by managing permissions and sharing settings within the Power BI service.
Real-Life Applications of Power BI: Success Stories and Case Studies
Power BI has proven to be an invaluable tool for businesses across various industries, enabling them to unlock insights, optimize operations, and make informed decisions. The following case studies demonstrate Power BI’s versatility and adaptability in addressing unique business challenges.
Case Study 1: Streamlining Sales Analytics for a Global Manufacturing Company
A multinational manufacturing company sought to improve its sales analytics capabilities to better understand market trends and customer preferences. By implementing Power BI, the company was able to consolidate data from multiple sources, including CRM, ERP, and supply chain systems. This resulted in a unified view of sales performance, allowing the organization to identify areas for improvement and optimize resource allocation.
Case Study 2: Enhancing Customer Experience for a Retail Chain
A large retail chain aimed to improve customer experience by gaining a deeper understanding of shopping behaviors and preferences. Using Power BI, the company integrated data from various sources, such as point-of-sale systems, loyalty programs, and social media platforms. This enabled the retailer to create personalized marketing campaigns, improve inventory management, and enhance the overall customer journey.
Case Study 3: Driving Operational Efficiency for a Healthcare Provider
A healthcare provider sought to optimize its operations by monitoring key performance indicators (KPIs) and identifying areas for improvement. By leveraging Power BI, the organization was able to create interactive dashboards that displayed real-time data on patient wait times, staff productivity, and resource utilization. This led to increased operational efficiency, improved patient satisfaction, and better resource management.
These success stories illustrate Power BI’s ability to deliver tangible business value across various industries. By harnessing the power of data, organizations can make informed decisions, streamline operations, and drive growth with the help of Power BI.
Comparing Power BI with Other Business Intelligence Tools
When considering a business intelligence tool, it’s essential to compare various options to determine which one best fits your organization’s needs. In this section, we’ll compare Power BI with other popular business intelligence tools, such as Tableau, Looker, and QlikView, focusing on aspects such as pricing, features, and user-friendliness.
Power BI vs. Tableau
Both Power BI and Tableau are robust business intelligence tools with extensive data visualization capabilities. However, Power BI offers a more cost-effective solution, especially for smaller teams and businesses. Power BI’s integration with Microsoft’s ecosystem, including Excel and Power Platform, provides additional value for organizations already using Microsoft products. On the other hand, Tableau offers a more polished and visually appealing interface, which some users might prefer.
Power BI vs. Looker
Looker is a web-based business intelligence platform that focuses on providing a seamless and integrated analytics experience. While Looker offers strong data modeling capabilities, Power BI’s extensive library of data connectors and customizable visualizations sets it apart. Power BI also provides a more flexible pricing structure, making it a more accessible option for various organizations.
Power BI vs. QlikView
QlikView is an associative data analytics tool that enables users to explore data without predefined queries. While QlikView offers advanced data analysis features, Power BI’s user-friendly interface and lower cost make it a more appealing option for many businesses. Power BI’s integration with Microsoft’s ecosystem and its robust data visualization capabilities further strengthen its competitive advantage.
In conclusion, Power BI’s unique value proposition lies in its comprehensive feature set, cost-effectiveness, and seamless integration with Microsoft’s ecosystem. By choosing Power BI, organizations can leverage a powerful business analytics tool that fosters data-driven decision-making and drives business performance.
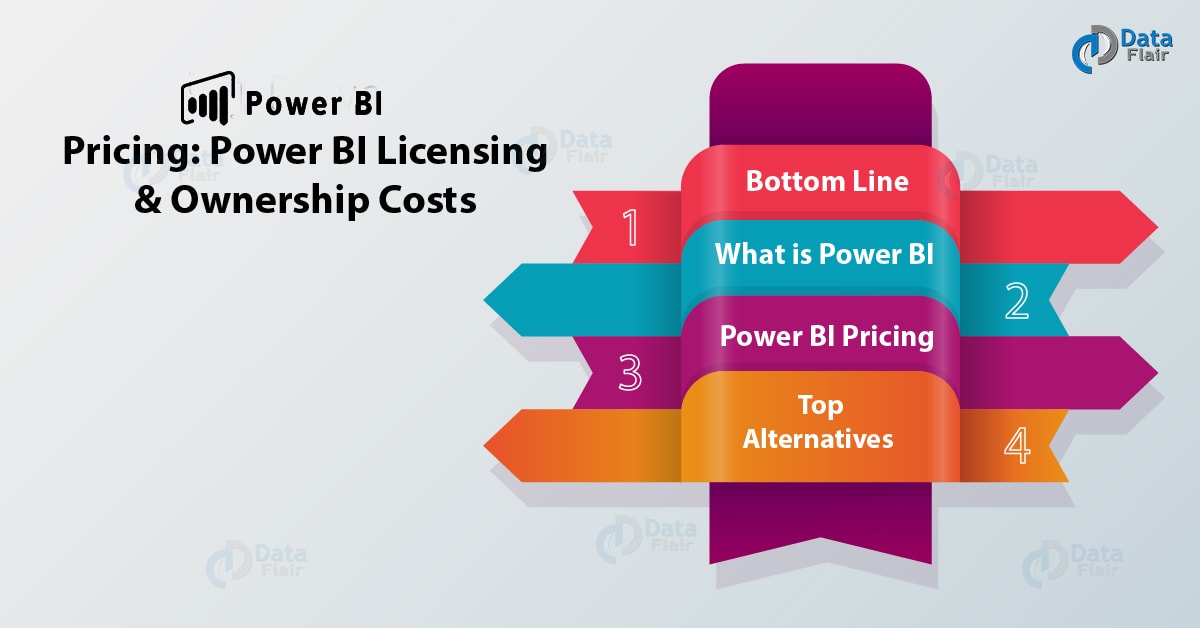
Power BI Pricing and Licensing: Choosing the Right Plan
Power BI offers a flexible pricing and licensing structure designed to cater to various organizational needs and budgets. Understanding the differences between Power BI’s free and paid plans can help you determine the most suitable option for your business.
Power BI Free
Power BI Free is a free, entry-level plan that provides users with access to essential Power BI features. This plan is ideal for individual users or small teams looking to explore Power BI’s capabilities without incurring any costs. However, it has limitations, such as a 1 GB per user data capacity and restricted sharing options.
Power BI Pro
Power BI Pro is a paid plan that offers advanced features and capabilities, including increased data capacity, real-time data streaming, and enhanced sharing options. Power BI Pro is suitable for teams and organizations that require more robust data analysis and collaboration features. Priced at a monthly rate per user, Power BI Pro provides a cost-effective solution for businesses seeking to unlock the full potential of Power BI.
Power BI Premium
Power BI Premium is a high-end plan designed for large enterprises and organizations with extensive data analysis requirements. Power BI Premium offers dedicated resources, increased data capacity, and advanced performance features. Unlike Power BI Pro, Power BI Premium does not require individual user licenses, making it a more cost-effective solution for organizations with numerous users.
When choosing a Power BI plan, consider factors such as team size, data volume, and advanced features. Power BI Free is suitable for individual users or small teams with limited data analysis needs, while Power BI Pro and Power BI Premium cater to businesses requiring more advanced features and larger data volumes. By selecting the right plan, organizations can maximize the value of Power BI and drive informed decision-making.
Trends and Future Developments in Power BI
Power BI is continuously evolving, with Microsoft regularly introducing new features and capabilities to enhance its business analytics tool. By staying informed about the latest trends and future developments in Power BI, organizations can leverage its full potential and maintain a competitive edge.
AI-Driven Insights
Artificial intelligence (AI) is revolutionizing the way businesses analyze and interpret data. Power BI is embracing AI technology by incorporating features such as natural language processing, machine learning, and cognitive services. These advancements enable users to ask questions in plain language and receive accurate, data-driven insights, making it easier to uncover hidden patterns and trends.
Real-Time Data Streaming
Real-time data streaming is becoming increasingly important for businesses that rely on up-to-the-minute data to make critical decisions. Power BI is addressing this need by offering real-time data streaming capabilities, allowing users to monitor and analyze data as it arrives, ensuring that their insights are always accurate and relevant.
Enhanced Collaboration Features
Collaboration is essential for modern businesses, and Power BI is committed to fostering a collaborative analytics environment. With features such as shared workspaces, real-time commenting, and seamless integration with Microsoft Teams, Power BI enables users to work together more effectively, driving informed decision-making and improving overall business performance.
By staying up-to-date with these trends and future developments, organizations can harness the full potential of Power BI and maintain a competitive edge in their respective industries. Embracing AI-driven insights, real-time data streaming, and enhanced collaboration features will enable businesses to make data-driven decisions more efficiently and effectively, ultimately driving growth and success.

Getting Started with Power BI: Tips and Best Practices
Implementing Power BI in your organization can significantly improve your business performance and decision-making capabilities. To help you get started on the right track, consider the following tips and best practices:
Leverage Online Resources
Microsoft offers a wealth of online resources, including documentation, tutorials, and community forums, to help users get the most out of Power BI. Take advantage of these resources to learn about Power BI’s features, capabilities, and best practices for using the platform.
Join User Communities
Connecting with other Power BI users can provide valuable insights, tips, and tricks for optimizing your Power BI experience. Join user communities, such as the Power BI Community or Microsoft’s Tech Community, to engage with like-minded professionals and stay up-to-date on the latest developments.
Attend Training Sessions
Microsoft and various third-party providers offer training sessions, webinars, and workshops to help users improve their Power BI skills. Participating in these sessions can help you better understand Power BI’s features and capabilities, enabling you to make the most of the platform.
Define Clear Objectives
Before diving into Power BI, define clear objectives for your data analytics and visualization efforts. Having well-defined goals will help you focus your efforts, ensuring that you get the most value from Power BI and drive informed decision-making in your organization.
Start Small and Scale Up
When implementing Power BI, start with small, manageable projects and gradually scale up as you become more comfortable with the platform. This approach will help you build a solid foundation and minimize potential issues or setbacks.
By following these tips and best practices, your organization can successfully adopt Power BI and begin reaping the benefits of data-driven decision-making. Embrace Power BI’s vast potential and unlock the insights hidden within your data, driving growth and success for your business.
