What is Power BI?
Power BI is a powerful business analytics tool developed by Microsoft, designed to provide organizations with a unified and intuitive solution for data analysis. The primary goal of Power BI is to enable businesses to make informed decisions based on data, by offering interactive visualizations and business intelligence capabilities. Power BI is part of a larger suite of Microsoft products, including Excel and Power Platform, and it seamlessly integrates with these tools to provide a comprehensive data analysis experience.
Key Features and Capabilities of Power BI
Power BI is a comprehensive business analytics tool that offers a wide range of features and capabilities to help organizations make data-driven decisions. One of the primary features of Power BI is its ability to create interactive visualizations, which allow users to easily explore and understand their data. Power BI supports a variety of visualization types, including charts, graphs, maps, and tables, and users can customize these visualizations to meet their specific needs.
Another key feature of Power BI is its data preparation capabilities. Power BI includes tools for cleaning, transforming, and enriching data, making it easier for users to prepare their data for analysis. Power BI also supports data modeling, allowing users to create relationships between different data sets and build sophisticated data models. This makes it possible to perform complex analyses and generate insights that would be difficult or impossible with traditional spreadsheet tools.
Power BI also excels in sharing and collaboration. Users can easily share their reports and dashboards with others, both inside and outside their organization. Power BI also includes features for managing access to data and reports, ensuring that sensitive information is protected. Additionally, Power BI integrates seamlessly with other Microsoft products, such as Excel and Power Platform, making it easy to incorporate data from these tools into Power BI reports and dashboards.
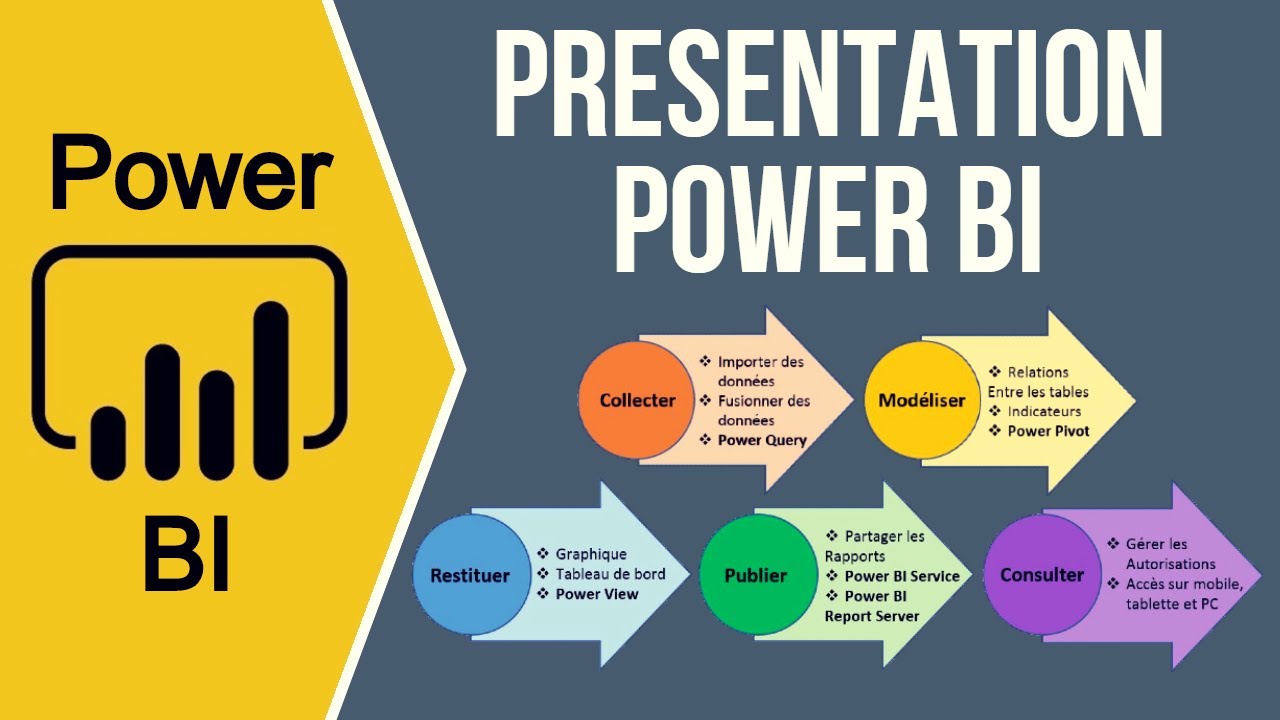
How to Use Power BI: A Step-by-Step Guide
Getting started with Power BI is a straightforward process. Here’s a brief tutorial on how to get up and running with Power BI:
-
Sign up for a Power BI account: To get started with Power BI, you’ll need to sign up for a Power BI account. You can do this by visiting the Power BI website and following the prompts to create a new account.
-
Connect to data sources: Once you have a Power BI account, you can start connecting to data sources. Power BI supports a wide range of data sources, including Excel, SQL Server, and Salesforce. To connect to a data source, simply select the “Get Data” option from the Power BI home screen and follow the prompts to connect to your data.
-
Create visualizations: After connecting to your data, you can start creating visualizations. Power BI includes a wide range of visualization options, including charts, graphs, and tables. To create a visualization, simply select the visualization type you want to use and drag and drop the fields you want to include in the visualization.
-
Share reports: Once you have created your visualizations, you can share them with others by creating a report. To create a report, simply select the “Create Report” option from the Power BI home screen and add the visualizations you want to include in the report. You can then share the report with others by publishing it to the Power BI service or sending a link to the report.
By following these steps, you can quickly get started with Power BI and begin exploring your data in new and insightful ways. With its user-friendly interface and powerful features, Power BI is an ideal tool for organizations looking to make data-driven decisions and drive business success.
Real-Life Applications of Power BI: Case Studies and Success Stories
Power BI has been successfully implemented by businesses and organizations across a wide range of industries, from healthcare and finance to retail and manufacturing. Here are a few examples of how Power BI has helped organizations improve decision-making, streamline processes, and enhance performance:
-
Healthcare: A large hospital system used Power BI to analyze patient data and identify trends in patient outcomes. By visualizing this data, the hospital was able to identify areas for improvement and take action to enhance patient care.
-
Finance: A financial services firm used Power BI to analyze market data and identify trends in customer behavior. By visualizing this data, the firm was able to make more informed investment decisions and improve customer engagement.
-
Retail: A retail chain used Power BI to analyze sales data and identify trends in customer purchasing behavior. By visualizing this data, the chain was able to optimize inventory levels, improve pricing strategies, and increase sales.
These case studies demonstrate the versatility and effectiveness of Power BI. By providing a unified, intuitive solution for data analysis, Power BI enables organizations to make informed decisions based on data, rather than relying on intuition or guesswork. With its powerful features and user-friendly interface, Power BI is an essential tool for any organization looking to harness the power of data and drive business success.

Comparing Power BI to Other Business Intelligence Tools
Power BI is not the only business intelligence tool on the market. There are several other popular tools, including Tableau, Looker, and QlikView. Here’s a comparison of these tools and how they stack up against Power BI in terms of features, pricing, and user experience:
-
Tableau: Tableau is a powerful business intelligence tool that is known for its data visualization capabilities. However, it can be more expensive than Power BI and may require more technical expertise to use. Power BI, on the other hand, offers a more user-friendly interface and is more affordable, making it a better choice for small to medium-sized businesses.
-
Looker: Looker is a business intelligence tool that focuses on data modeling and collaboration. It offers a unique modeling language called LookML, which can be more difficult to learn than Power BI’s drag-and-drop interface. Power BI, on the other hand, offers a more intuitive interface and is better suited for users who are new to business intelligence.
-
QlikView: QlikView is a business intelligence tool that is known for its in-memory data processing capabilities. However, it can be more expensive than Power BI and may require more technical expertise to use. Power BI, on the other hand, offers a more user-friendly interface and is more affordable, making it a better choice for small to medium-sized businesses.
In summary, while there are several other business intelligence tools on the market, Power BI stands out for its user-friendly interface, powerful features, and affordability. By providing a unified, intuitive solution for data analysis, Power BI enables organizations to make informed decisions based on data, rather than relying on intuition or guesswork. With its powerful features and user-friendly interface, Power BI is an essential tool for any organization looking to harness the power of data and drive business success.

Best Practices for Implementing Power BI in Your Organization
Implementing Power BI in your organization can be a powerful way to improve decision-making, streamline processes, and enhance performance. However, it’s important to approach the implementation process with a clear plan and a focus on best practices. Here are some tips for successfully implementing Power BI in your organization:
-
Involve stakeholders: It’s important to involve key stakeholders in the implementation process, including business users, IT professionals, and executives. By involving stakeholders from the beginning, you can ensure that the implementation aligns with business needs and that there is buy-in from all parties.
-
Set clear goals: Before implementing Power BI, it’s important to set clear goals for what you hope to achieve. This will help you measure the success of the implementation and ensure that you are getting the most value from the tool.
-
Focus on data governance: Data governance is critical for ensuring the accuracy, consistency, and security of your data. It’s important to establish clear data governance policies and procedures before implementing Power BI, and to ensure that all users are trained on these policies.
-
Provide training: Power BI is a powerful tool, but it can also be complex. It’s important to provide training to all users to ensure that they are able to use the tool effectively. This can include online tutorials, in-person training sessions, and user guides.
-
Measure success: After implementing Power BI, it’s important to measure the success of the implementation. This can include tracking key performance indicators (KPIs), gathering feedback from users, and conducting regular reviews to ensure that the tool is meeting business needs.
By following these best practices, you can ensure a successful implementation of Power BI in your organization. With its powerful features and user-friendly interface, Power BI can help you unlock the value of your data and make informed decisions that drive business success.

The Future of Power BI: Trends and Innovations to Watch
Power BI is a powerful business intelligence tool that is constantly evolving to meet the needs of organizations. Here are some of the latest trends and innovations in business intelligence and how they relate to Power BI:
-
Artificial intelligence and machine learning: Artificial intelligence (AI) and machine learning (ML) are becoming increasingly important in business intelligence. Power BI is integrating AI and ML capabilities to help users analyze data more efficiently and make more accurate predictions. For example, Power BI includes features like Quick Insights, which uses AI to automatically identify trends and patterns in data, and Key Influencers, which uses ML to help users understand the factors that are driving specific metrics.
-
Natural language processing: Natural language processing (NLP) is another area where Power BI is making strides. NLP allows users to interact with data using natural language queries, making it easier to analyze data without needing to write complex queries. Power BI includes features like Q&A, which allows users to ask questions about their data using natural language, and Cortana integration, which allows users to use voice commands to interact with their data.
-
Real-time analytics: Real-time analytics is becoming increasingly important for organizations that need to make quick decisions based on up-to-the-minute data. Power BI includes features like real-time streaming data, which allows users to see data as it is generated, and push notifications, which alert users to important changes in their data.
-
Mobile-first design: With more and more users accessing data on mobile devices, Power BI is focusing on mobile-first design. Power BI includes features like mobile-optimized reports, which are designed to be easy to read and interact with on mobile devices, and push notifications, which alert users to important changes in their data.
By staying on top of these trends and innovations, Power BI is ensuring that it remains a powerful and relevant business intelligence tool for organizations. With its focus on user-friendly design, seamless integration with other Microsoft products, and powerful analytics capabilities, Power BI is well-positioned to help organizations make data-driven decisions and drive business success.
Conclusion: The Power of Power BI for Business Intelligence
Power BI is a powerful business analytics tool that can help organizations make informed decisions based on data. With its user-friendly interface, seamless integration with other Microsoft products, and robust analytics capabilities, Power BI is a popular choice for businesses and organizations of all sizes. By providing a unified, intuitive solution for data analysis, Power BI enables organizations to make data-driven decisions that drive business success.
Throughout this article, we have explored the key features and capabilities of Power BI, provided a step-by-step guide for getting started with the tool, and shared real-life examples of how organizations have successfully implemented Power BI to improve decision-making, streamline processes, and enhance performance. We have also compared Power BI to other popular business intelligence tools and discussed best practices for implementing Power BI in your organization.
As we look to the future of business intelligence, it is clear that topics such as artificial intelligence, machine learning, and natural language processing will continue to play an important role in the evolution of tools like Power BI. By staying on top of these trends and innovations, organizations can ensure that they are making the most of their data and driving business success.
If you are considering a business analytics tool for your organization, we encourage you to explore Power BI further. With its powerful features, user-friendly interface, and seamless integration with other Microsoft products, Power BI is an excellent choice for organizations looking to make data-driven decisions and drive business success.