
The Role of Visualization and Reporting in Cloud Computing
Visualization and reporting tools play a pivotal role in cloud computing, empowering businesses to effectively interpret and utilize their data. These tools facilitate data-driven decision-making, resource optimization, and enhanced collaboration within and across teams. By transforming raw data into actionable insights, visualization and reporting solutions help organizations identify trends, patterns, and opportunities, ultimately driving growth and success.

Comparing Top Cloud-Based Visualization and Reporting Platforms
Visualization and reporting tools are essential for businesses seeking to unlock the potential of their data in cloud environments. Several popular platforms, including Tableau, Power BI, and Google Data Studio, offer robust features and capabilities to help organizations make data-driven decisions, optimize resources, and enhance collaboration. Understanding the unique strengths and weaknesses of each platform can help businesses make informed decisions when selecting the right tool for their needs.
Tableau
Tableau is a widely-used data visualization and reporting platform that offers a range of features, including real-time data connectivity, advanced analytics, and customizable dashboards. Tableau supports a variety of data sources and integrations, making it a versatile solution for businesses of all sizes. Pricing for Tableau starts at $70 per user per month for Tableau Creator, while Tableau Explorer and Tableau Viewer are available for $35 and $12 per user per month, respectively.
Power BI
Power BI, a product of Microsoft, is a cloud-based visualization and reporting platform that offers seamless integration with other Microsoft tools, such as Excel and SharePoint. Power BI supports a wide range of data sources and offers advanced analytics capabilities, including machine learning and natural language processing. Pricing for Power BI starts at $9.99 per user per month for the Power BI Pro plan, while the Power BI Premium plan is available for $20 per user per month or as a dedicated capacity for $4,995 per month.
Google Data Studio
Google Data Studio is a free, cloud-based visualization and reporting platform that offers customizable reports and dashboards. Data Studio integrates with Google’s suite of tools, including Google Analytics, Google Sheets, and Google Ads, making it an ideal solution for businesses already using Google’s ecosystem. While Data Studio is a free platform, users can upgrade to Google Workspace for additional features and integrations.
When selecting a visualization and reporting platform for cloud environments, businesses should consider several factors, including:
- Integration with existing tools and systems
- Data source compatibility
- Scalability and performance
- Security and compliance
- User experience and ease of use
- Pricing and total cost of ownership
By carefully evaluating these factors and comparing the features and capabilities of top cloud-based visualization and reporting platforms, businesses can select the right tool to meet their unique needs and drive success in cloud environments.
How to Implement Visualization and Reporting Tools in Your Cloud Environment
Visualization and reporting tools are essential for businesses seeking to unlock the potential of their data in cloud environments. Integrating these tools into a cloud environment can help organizations make data-driven decisions, optimize resources, and enhance collaboration. By following a step-by-step process and implementing best practices, businesses can ensure a smooth implementation process and maximize the value of their visualization and reporting tools.
Step 1: Define Your Business Needs and Goals
Before selecting and implementing visualization and reporting tools, businesses should define their specific needs and goals. This may include identifying key performance indicators (KPIs), data sources, and user roles and permissions. By clearly defining these requirements, businesses can select the right tools and ensure a successful implementation.
Step 2: Evaluate and Select the Right Tools
Once businesses have defined their needs and goals, they can evaluate and select the right visualization and reporting tools for their cloud environment. Popular platforms, such as Tableau, Power BI, and Google Data Studio, offer a range of features and capabilities to meet the unique needs of businesses. When evaluating these tools, businesses should consider factors such as integration with existing tools and systems, data source compatibility, scalability and performance, security and compliance, user experience and ease of use, and pricing and total cost of ownership.
Step 3: Prepare and Clean Your Data
Before integrating visualization and reporting tools into a cloud environment, businesses should prepare and clean their data. This may include consolidating data sources, standardizing data formats, and addressing any data quality issues. By ensuring that data is clean and accurate, businesses can ensure that their visualization and reporting tools provide accurate and reliable insights.
Step 4: Integrate Visualization and Reporting Tools into Your Cloud Environment
Once data is prepared and cleaned, businesses can integrate visualization and reporting tools into their cloud environment. This may involve configuring data connections, creating custom dashboards and reports, and setting up user roles and permissions. By following the vendor’s documentation and best practices, businesses can ensure a smooth implementation process.
Step 5: Test and Validate Your Visualization and Reporting Tools
After integrating visualization and reporting tools into a cloud environment, businesses should test and validate their tools to ensure that they are providing accurate and reliable insights. This may involve testing data connections, validating report outputs, and ensuring that user roles and permissions are properly configured.
Best Practices for Implementing Visualization and Reporting Tools in Cloud Environments
When implementing visualization and reporting tools in cloud environments, businesses should follow best practices to ensure a smooth implementation process and maximize the value of their tools. These best practices may include:
- Involving stakeholders and end-users in the implementation process
- Providing training and support for end-users
- Establishing data governance policies and procedures
- Monitoring and optimizing tool performance and scalability
- Regularly reviewing and updating visualization and reporting tools to meet changing business needs and goals
By following these steps and best practices, businesses can successfully integrate visualization and reporting tools into their cloud environment and unlock the potential of their data to make data-driven decisions, optimize resources, and enhance collaboration.
Real-Life Success Stories: Visualization and Reporting in Action
Visualization and reporting tools have become essential for businesses seeking to unlock the potential of their data in cloud environments. By providing powerful insights and enabling data-driven decision-making, these tools have helped businesses optimize resources, enhance collaboration, and drive growth. In this section, we will share success stories of businesses that have effectively utilized visualization and reporting tools in their cloud environments. By highlighting the benefits they experienced and the challenges they overcame, we hope to inspire and inform other businesses considering these tools.
Case Study 1: Healthcare Company Improves Patient Care with Real-Time Analytics
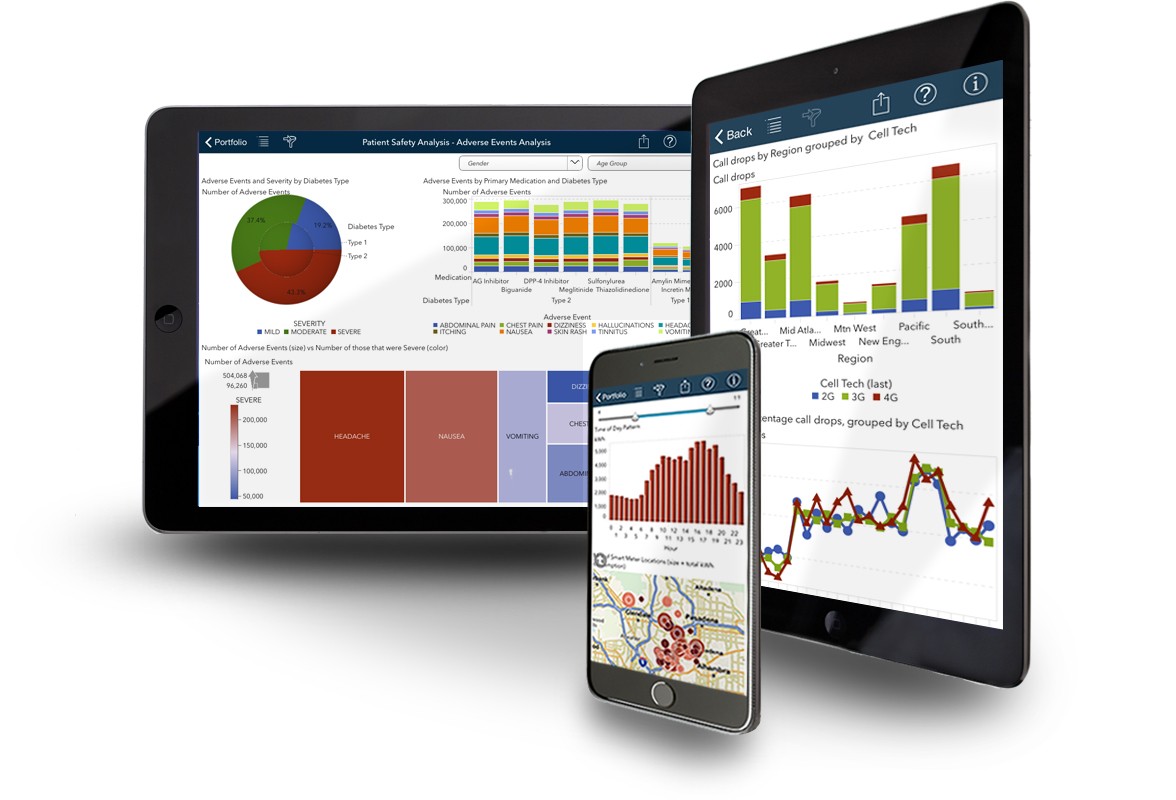
A healthcare company sought to improve patient care and outcomes by leveraging real-time analytics and visualization tools in their cloud environment. By integrating data from various sources, including electronic health records, medical devices, and patient feedback, the company was able to create custom dashboards and reports that provided real-time insights into patient health and care. As a result, the company was able to identify trends and patterns in patient data, improve care coordination, and reduce hospital readmissions.
Case Study 2: Retailer Increases Sales and Customer Satisfaction with Interactive Reports
A retailer sought to increase sales and customer satisfaction by providing interactive reports and visualizations to their sales team. By integrating data from various sources, including point-of-sale systems, customer feedback, and inventory management, the company was able to create custom dashboards and reports that provided real-time insights into sales trends, customer behavior, and inventory levels. As a result, the sales team was able to identify opportunities for upselling and cross-selling, improve inventory management, and increase customer satisfaction.
Case Study 3: Manufacturer Reduces Costs and Improves Efficiency with Predictive Analytics
A manufacturer sought to reduce costs and improve efficiency by leveraging predictive analytics and visualization tools in their cloud environment. By integrating data from various sources, including production equipment, supply chain management, and quality control, the company was able to create custom dashboards and reports that provided real-time insights into production trends, equipment performance, and quality issues. As a result, the company was able to identify opportunities for process optimization, reduce downtime, and improve overall efficiency.
These success stories demonstrate the potential of visualization and reporting tools in cloud environments to drive business growth and success. By providing powerful insights and enabling data-driven decision-making, these tools have helped businesses optimize resources, enhance collaboration, and improve customer satisfaction. However, implementing these tools is not without its challenges. In the next section, we will discuss best practices for implementing visualization and reporting tools in cloud environments, including potential obstacles and solutions.

Security Best Practices for Cloud-Based Visualization and Reporting
Visualization and reporting tools in cloud environments have become increasingly popular due to their ability to help businesses make data-driven decisions, optimize resources, and enhance collaboration. However, with the growing use of these tools, it is essential to prioritize security to protect sensitive data and maintain compliance with regulations. In this section, we will discuss common security risks and provide recommendations for protecting sensitive data when using cloud-based visualization and reporting tools.
Understanding Security Risks
Cloud-based visualization and reporting tools often involve the transfer and storage of sensitive data, making them attractive targets for cybercriminals. Common security risks include data breaches, unauthorized access, and data loss. To mitigate these risks, businesses must implement robust security measures and follow best practices for data protection.
Implementing Security Measures
To ensure the security of cloud-based visualization and reporting tools, businesses should consider the following best practices:
- Data Encryption: Encrypt data both in transit and at rest to protect it from unauthorized access.
- Access Control: Implement strict access controls to ensure that only authorized users can access sensitive data.
- Security Policies: Establish clear security policies and procedures for using visualization and reporting tools in the cloud.
- Regular Audits: Conduct regular security audits to identify vulnerabilities and ensure compliance with regulations.
- Employee Training: Provide training to employees on security best practices and the importance of protecting sensitive data.
Choosing Secure Visualization and Reporting Tools
When selecting cloud-based visualization and reporting tools, businesses should consider the following security features:
- Data Privacy: Ensure that the tool complies with data privacy regulations and has robust data protection measures in place.
- Access Control: Look for tools that offer granular access controls and user authentication features.
- Audit Trails: Choose tools that provide audit trails and activity logs to monitor user activity and detect potential security threats.
- Incident Response: Ensure that the tool has a robust incident response plan in place to address security breaches and other incidents.
By following these best practices and choosing secure visualization and reporting tools, businesses can mitigate security risks and protect sensitive data in cloud environments. It is essential to prioritize security when implementing these tools to ensure the long-term success and sustainability of the business.
Emerging Trends in Visualization and Reporting for Cloud Environments
Visualization and reporting tools in cloud environments have become increasingly popular due to their ability to help businesses make data-driven decisions, optimize resources, and enhance collaboration. As technology continues to evolve, new trends and innovations are emerging in visualization and reporting for cloud environments. In this section, we will explore the latest trends and discuss their potential impact on businesses and the future of cloud computing.
Data Storytelling
Data storytelling is a trend that involves using visualization and reporting tools to create compelling narratives around data. By presenting data in a more engaging and accessible way, businesses can better communicate insights and drive action. Data storytelling can help businesses to better understand their customers, identify trends, and make informed decisions.
Real-Time Analytics
Real-time analytics is another emerging trend in visualization and reporting for cloud environments. Real-time analytics enables businesses to monitor data in real-time, providing immediate insights and enabling faster decision-making. Real-time analytics can help businesses to identify issues and opportunities as they arise, enabling them to take action quickly and effectively.
Artificial Intelligence and Machine Learning
Artificial intelligence (AI) and machine learning (ML) are becoming increasingly important in visualization and reporting for cloud environments. AI and ML can help businesses to automate data analysis, identify patterns and trends, and make predictions. By leveraging AI and ML, businesses can gain deeper insights into their data and make more informed decisions.
Collaborative Visualization
Collaborative visualization is a trend that involves enabling multiple users to collaborate on data visualization and reporting projects in real-time. Collaborative visualization can help businesses to improve communication, enhance teamwork, and make better decisions. By enabling real-time collaboration, businesses can accelerate the decision-making process and improve overall performance.
Integration with Internet of Things (IoT) Devices
Integration with IoT devices is becoming increasingly important in visualization and reporting for cloud environments. By integrating with IoT devices, businesses can gain real-time insights into their operations and make data-driven decisions. Integration with IoT devices can help businesses to improve efficiency, reduce costs, and enhance customer experiences.
By staying up-to-date with the latest trends and innovations in visualization and reporting for cloud environments, businesses can gain a competitive advantage and drive success. By leveraging these trends, businesses can make more informed decisions, optimize resources, and enhance collaboration, ultimately leading to improved performance and long-term sustainability.
Overcoming Common Challenges in Visualization and Reporting for Cloud Environments</h

Assessing the Return on Investment of Cloud-Based Visualization and Reporting Tools
In today’s data-driven world, businesses increasingly rely on visualization and reporting tools in cloud environments to make informed decisions, optimize resources, and enhance collaboration. However, before adopting these tools, it is crucial for organizations to understand their financial benefits and assess the return on investment (ROI).
Calculating ROI involves comparing the benefits and costs associated with implementing cloud-based visualization and reporting tools. The benefits may include increased efficiency, improved decision-making, and enhanced data security. On the other hand, costs can encompass software licenses, training, and maintenance.
To measure the ROI, businesses can use key performance indicators (KPIs) such as time saved, increased sales, or reduced operational costs. For instance, if a company can reduce its decision-making time by 20% by using visualization and reporting tools, this time savings can be translated into monetary terms and compared with the investment costs.
Moreover, it is essential to consider the long-term value of these tools. While the upfront costs may seem high, the long-term benefits can outweigh the initial investment. For example, cloud-based visualization and reporting tools can provide businesses with a competitive advantage by enabling them to analyze data in real-time and make quick decisions.
Furthermore, these tools can help businesses optimize their resources by identifying areas of inefficiency and reducing waste. By visualizing and reporting on data, organizations can gain insights into their operations and make data-driven decisions that lead to cost savings and increased revenue.
In conclusion, assessing the ROI of cloud-based visualization and reporting tools is crucial for businesses looking to make informed investment decisions. By measuring the benefits and costs and considering the long-term value, organizations can ensure that they are maximizing their investment and achieving their desired outcomes.
