What is SSM Logging and Why is it Important?
SSM (Simple Systems Manager) logging is a feature of the AWS (Amazon Web Services) SSM service that enables users to view, analyze, and manage logs generated by their SSM-managed resources. SSM logging is crucial for monitoring and troubleshooting applications, as it provides valuable insights into the performance, security, and compliance of your systems.
SSM logging offers several benefits, including improved system performance, enhanced security, and better compliance. By analyzing SSM logs, you can quickly identify and resolve performance issues, detect and respond to security threats, and ensure compliance with various regulations and standards.
SSM logging is an essential tool for organizations that rely on AWS SSM to manage their infrastructure. It provides a centralized location for viewing and managing logs, reducing the need for manual log analysis and enabling faster and more efficient troubleshooting. With SSM logging, you can quickly identify and resolve issues, improving the overall reliability and performance of your systems.
In summary, SSM logging is a powerful feature of the AWS SSM service that enables users to view, analyze, and manage logs generated by their SSM-managed resources. By using SSM logging, organizations can improve system performance, enhance security, and ensure compliance with various regulations and standards. In the following sections, we will discuss how to implement SSM logging in your applications and best practices for using it to ensure optimal performance and efficiency.
How to Implement SSM Logging in Your Applications
Implementing SSM logging in your applications is a straightforward process that can be accomplished in a few simple steps. In this section, we will provide a step-by-step guide on how to implement SSM logging in your applications, including code examples and best practices for configuring and using SSM logs.
To get started with SSM logging, you will need to have an AWS account and have the AWS CLI installed on your local machine. Once you have these prerequisites in place, you can begin configuring SSM logging for your applications.
The first step in implementing SSM logging is to create an SSM document that defines the logs you want to collect. An SSM document is a JSON file that specifies the configuration settings for your logs, including the log group, log stream, and log retention settings. Here is an example SSM document that configures SSM logging for an application running on an EC2 instance:
“`json { “schemaVersion”: “2.0”, “description”: “Configure SSM logging for an EC2 instance”, “parameters”: {}, “mainSteps”: [ { “action”: “aws:runCommand”, “name”: “ConfigureSSMLogging”, “inputs”: { “documents”: [ “AWS-RunPowerShellScript” ], “parameters”: { “commands”: [ “New-Object -TypeName Amazon.SimpleLogService.AmazonSimpleLogServiceClient -Region us-west-2”, “New-S3LogGroup -LogGroupName my-log-group -RetentionInDays 30” ] } } } ] } “`
Once you have created your SSM document, you can use the AWS CLI to execute the document on your EC2 instance. Here is an example command that executes the SSM document on an EC2 instance:
“`css aws ssm send-command –document-name “ConfigureSSMLogging” –instance-ids “i-1234567890abcdef0” “`
After executing the SSM document, you can view the logs generated by your application in the SSM console. You can also use the AWS CLI to query and analyze the logs using commands such as aws logs filter-log-events and aws logs describe-log-groups.
When configuring SSM logging, it is important to follow best practices for log rotation, retention, and analysis. This includes setting appropriate log retention policies, using log filters to identify and analyze specific log events, and integrating SSM logging with other monitoring tools such as CloudWatch for a more comprehensive view of your application’s performance and health.
In summary, implementing SSM logging in your applications is a straightforward process that can be accomplished in a few simple steps. By following the best practices outlined in this section, you can ensure optimal performance and efficiency when using SSM logging. In the following sections, we will discuss these best practices in more detail and provide real-world examples of how SSM logging has been used to troubleshoot and resolve common application issues.
SSM Logging Best Practices for Optimal Performance
SSM logging is a powerful tool for monitoring and troubleshooting applications, but it’s important to follow best practices to ensure optimal performance and efficiency. In this section, we will discuss the best practices for using SSM logging, including log rotation, retention, and analysis.
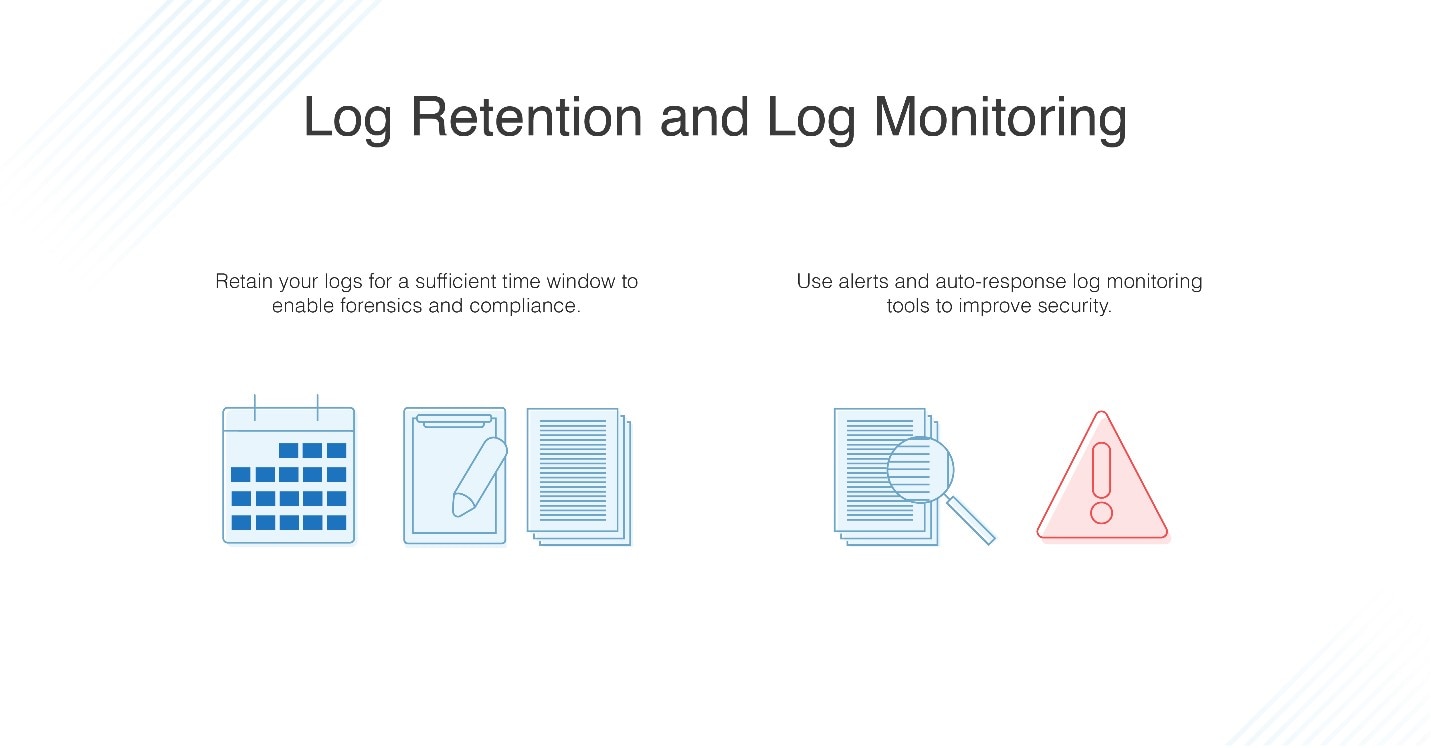
One of the most important best practices for SSM logging is log rotation. Log rotation is the process of periodically archiving old logs and creating new ones to prevent the log files from becoming too large and unwieldy. SSM logging supports log rotation by default, and you can configure the log rotation settings using the AWS CLI or the SSM console. When configuring log rotation, it’s important to set an appropriate log retention policy to ensure that you don’t retain logs for longer than necessary, which can consume unnecessary storage resources.
Another best practice for SSM logging is log analysis. Log analysis is the process of examining log data to identify trends, patterns, and anomalies that can indicate potential issues or opportunities for optimization. SSM logging supports log analysis using tools such as CloudWatch Logs Insights, which enables you to search, analyze, and visualize your log data in real-time. When analyzing logs, it’s important to use appropriate filters and queries to focus on the most relevant data and to avoid overwhelming yourself with unnecessary information.
When using SSM logging, it’s also important to consider security and compliance. SSM logging supports encryption at rest and in transit, and you can configure access controls to ensure that only authorized users can view or modify your logs. When configuring access controls, it’s important to follow the principle of least privilege, which means granting users only the permissions they need to perform their job functions.
In addition to these best practices, there are several other tips and tricks for optimizing SSM logging. For example, you can use AWS Lambda functions to automate common log management tasks, such as archiving old logs or triggering alerts based on log data. You can also use AWS Kinesis Data Firehose to stream your logs to other AWS services, such as Amazon S3 or Amazon Elasticsearch, for long-term storage and analysis.
In summary, following best practices for SSM logging is essential for ensuring optimal performance and efficiency. By implementing log rotation, retention, and analysis best practices, you can ensure that your logs are well-organized, easily searchable, and secure. In the following sections, we will provide real-world examples of how SSM logging has been used to troubleshoot and resolve common application issues, and we will compare SSM logging to other logging solutions to help you determine the best choice for your use case and scenario.
Integrating SSM Logging with Other Monitoring Tools
SSM logging is a powerful tool for monitoring and troubleshooting applications, but it’s even more powerful when integrated with other monitoring tools. By integrating SSM logging with other monitoring tools, you can provide a more comprehensive view of your application’s performance and health. In this section, we will explain how to integrate SSM logging with other monitoring tools, such as CloudWatch.
To integrate SSM logging with CloudWatch, you can use the AWS CLI or the SSM console. Here’s an example of how to use the AWS CLI to send SSM logs to CloudWatch:
aws logs put-log-events --log-group-name my-log-group --log-stream-name my-log-stream --log-events timestamped-log-events In this example, my-log-group is the name of the CloudWatch log group, my-log-stream is the name of the CloudWatch log stream, and timestamped-log-events is a JSON array of log events, where each log event includes a timestamp.
Once you have sent your SSM logs to CloudWatch, you can use CloudWatch Logs Insights to search, analyze, and visualize your log data. CloudWatch Logs Insights supports powerful query language that enables you to filter, aggregate, and analyze your log data in real-time. Here’s an example of a CloudWatch Logs Insights query that retrieves the top 10 error messages in your SSM logs:
fields @message | parse @message '*Error:*' as errorMessage | sort errorMessage desc | limit 10 By integrating SSM logging with CloudWatch, you can take advantage of CloudWatch’s powerful log analysis and visualization capabilities. You can also use CloudWatch alarms to trigger notifications or automated actions based on log data, such as sending an email when a critical error occurs.
In addition to CloudWatch, there are several other monitoring tools that you can integrate with SSM logging. For example, you can use Fluentd or Logstash to collect, process, and forward your SSM logs to other destinations, such as Elasticsearch or Kibana. You can also use AWS Kinesis Data Firehose to stream your SSM logs to other AWS services, such as Amazon S3 or Amazon Redshift, for long-term storage and analysis.
In summary, integrating SSM logging with other monitoring tools can provide a more comprehensive view of your application’s performance and health. By using tools such as CloudWatch, Fluentd, Logstash, and Kinesis Data Firehose, you can collect, process, and analyze your SSM logs in real-time, trigger notifications or automated actions based on log data, and store your logs for long-term analysis. In the following sections, we will provide real-world examples of how SSM logging has been used to troubleshoot and resolve common application issues, and we will compare SSM logging to other logging solutions to help you determine the best choice for your use case and scenario.
SSM Logging Use Cases: Real-World Examples
SSM logging is a powerful tool for monitoring and troubleshooting applications, and it has been successfully implemented by organizations across various industries. In this section, we will provide real-world examples of how SSM logging has been used to troubleshoot and resolve common application issues. We will also include case studies and testimonials from organizations that have successfully implemented SSM logging.
Case Study 1: Troubleshooting Application Performance Issues
A software development company was experiencing performance issues with one of their applications. The application was slow and unresponsive, and users were reporting errors and crashes. The development team used SSM logging to monitor the application’s performance and identify the root cause of the issue.
By analyzing the SSM logs, the development team discovered that the application was experiencing high CPU usage and memory leaks. They used SSM logging to track the application’s resource usage over time and identify trends and patterns. They also used SSM logs to correlate application performance with other system metrics, such as network traffic and disk I/O.
Based on the SSM logs, the development team was able to optimize the application’s resource usage and resolve the performance issues. They also implemented SSM logging best practices, such as log rotation and retention, to ensure optimal performance and efficiency.
Case Study 2: Ensuring Compliance with Regulations
A healthcare organization was required to comply with HIPAA regulations, which mandate the protection of patient health information. The organization used SSM logging to monitor their systems and ensure compliance with HIPAA regulations.
By using SSM logs, the healthcare organization was able to track user activity, monitor system access, and detect potential security threats. They also used SSM logs to generate compliance reports and demonstrate their compliance with HIPAA regulations.
Testimonial: Successfully Implementing SSM Logging
“SSM logging has been a game-changer for our organization. It has enabled us to monitor our applications in real-time, troubleshoot issues quickly, and ensure compliance with regulations. The SSM logging best practices have also helped us optimize our system performance and efficiency.” – IT Manager, Software Development Company
In summary, SSM logging has been successfully implemented by organizations across various industries to troubleshoot and resolve common application issues, ensure compliance with regulations, and optimize system performance and efficiency. By using SSM logging, organizations can gain valuable insights into their applications and systems, improve their security and compliance posture, and provide a better user experience. In the following sections, we will compare SSM logging to other logging solutions and discuss the advantages and disadvantages of each. We will also discuss the security and compliance considerations of using SSM logging and look to the future of SSM logging, including trends and predictions for this technology.
SSM Logging vs. Other Logging Solutions: A Comparison
When it comes to logging solutions, there are many options available, each with its own advantages and disadvantages. In this section, we will compare SSM logging to other logging solutions, such as Fluentd and Logstash, and discuss the advantages and disadvantages of each. We will also explain why SSM logging may be the best choice for certain use cases and scenarios.
Fluentd
Fluentd is an open-source data collector for unified logging layers. It allows you to collect data from various sources, such as logs, metrics, and traces, and unify them into a single data stream. Fluentd supports various output plugins, such as Elasticsearch, Kafka, and Splunk, making it a flexible and scalable logging solution.
The main advantage of Fluentd is its flexibility and scalability. It can handle large volumes of data and support various data sources and output plugins. However, Fluentd can be complex to configure and manage, especially for large-scale deployments. It also requires a significant amount of resources, such as CPU and memory, to run efficiently.
Logstash
Logstash is an open-source data processing pipeline that allows you to collect, process, and analyze logs and other data. It supports various input plugins, such as file, network, and database, and output plugins, such as Elasticsearch, Kafka, and Splunk. Logstash also supports various filters, such as grok and geoip, to extract and transform data.
The main advantage of Logstash is its flexibility and customizability. It supports various input, output, and filter plugins, making it a versatile logging solution. However, Logstash can be complex to configure and manage, especially for large-scale deployments. It also requires a significant amount of resources, such as CPU and memory, to run efficiently.
SSM Logging
SSM logging is a managed logging service provided by AWS that allows you to collect, analyze, and store logs from your AWS resources. It supports various log sources, such as EC2 instances, Lambda functions, and ECS containers, and output plugins, such as CloudWatch, Kinesis Data Firehose, and Splunk. SSM logging also supports various filters, such as log type and severity, to extract and transform data.
The main advantage of SSM logging is its ease of use and integration with other AWS services. It provides a simple and intuitive user interface for configuring and managing logs. It also integrates seamlessly with other AWS services, such as CloudWatch and Kinesis Data Firehose, making it a powerful and scalable logging solution. However, SSM logging is limited to AWS resources and may not support all data sources and output plugins compared to Fluentd and Logstash.
Choosing the Right Logging Solution
When choosing a logging solution, it’s essential to consider your use case and requirements. If you require a flexible and scalable logging solution that supports various data sources and output plugins, Fluentd or Logstash may be the best choice. However, if you require a simple and easy-to-use logging solution that integrates seamlessly with other AWS services, SSM logging may be the best choice.
In summary, SSM logging is a powerful and scalable logging solution that provides a simple and intuitive user interface for configuring and managing logs. While it may not support all data sources and output plugins compared to Fluentd and Logstash, it integrates seamlessly with other AWS services, making it a powerful and versatile logging solution. By considering your use case and requirements, you can choose the right logging solution that meets your needs and provides value and usefulness to your organization.
SSM Logging Security and Compliance Considerations
When implementing SSM logging in your applications, it’s important to consider the security and compliance implications. SSM logging can help you meet various regulatory requirements, such as HIPAA and PCI-DSS, but it’s essential to properly configure and manage your logs to ensure compliance.
Protecting Your Logs from Unauthorized Access
To protect your logs from unauthorized access, it’s important to follow best practices for security and access control. This includes using encryption, access control policies, and secure communication channels. You should also regularly review your logs to detect and respond to any potential security threats.
SSM logging supports encryption at rest and in transit, which helps protect your logs from unauthorized access. You can also use access control policies, such as Identity and Access Management (IAM) policies, to control who can access your logs. Additionally, you can use secure communication channels, such as HTTPS and SSH, to encrypt your log data in transit.
Meeting Regulatory Requirements
SSM logging can help you meet various regulatory requirements, such as HIPAA and PCI-DSS. These regulations mandate specific security and compliance measures for handling sensitive data, such as electronic protected health information (ePHI) and credit card information.
To meet these requirements, you should properly configure and manage your SSM logs. This includes using encryption, access control policies, and secure communication channels. You should also regularly review your logs to detect and respond to any potential security threats. Additionally, you should maintain proper documentation and reporting to demonstrate your compliance with regulatory requirements.
Best Practices for Compliance
To ensure compliance with regulatory requirements, it’s important to follow best practices for SSM logging. This includes regularly reviewing your logs, using encryption and access control policies, and maintaining proper documentation and reporting.
You should also consider implementing a log management strategy that includes log rotation, retention, and analysis. This will help you manage your logs efficiently and effectively, and ensure that you can quickly detect and respond to any potential security threats.
Conclusion
SSM logging is a powerful tool for monitoring and troubleshooting applications, but it’s important to consider the security and compliance implications. By following best practices for security and access control, you can protect your logs from unauthorized access and ensure compliance with regulatory requirements. By implementing a log management strategy that includes log rotation, retention, and analysis, you can manage your logs efficiently and effectively, and ensure that you can quickly detect and respond to any potential security threats.
The Future of SSM Logging: Trends and Predictions
SSM logging has come a long way since its inception, and it continues to evolve and improve. In this section, we will look to the future of SSM logging and discuss the trends and predictions for this technology. We will also explain how SSM logging is likely to evolve and what new features and capabilities we can expect to see in the coming years.
Improved Analytics and Visualization
One trend in SSM logging is the improvement of analytics and visualization capabilities. With more advanced analytics and visualization tools, SSM logging will be able to provide more insights and actionable information to users. This will help users to better understand their application’s performance and health, and make more informed decisions.
Integration with More AWS Services
Another trend in SSM logging is the integration with more AWS services. As AWS continues to expand its offerings, SSM logging is likely to integrate with more AWS services, such as Lambda, Fargate, and EKS. This will provide users with a more comprehensive view of their application’s performance and health, and make it easier to manage and troubleshoot their applications.
Machine Learning and AI
Machine learning and AI are also becoming more prevalent in SSM logging. With machine learning and AI, SSM logging can automatically detect anomalies, predict issues, and provide recommendations for resolution. This will help users to proactively address issues before they become critical, and improve their overall application’s performance and health.
Security and Compliance Enhancements
Security and compliance are always top of mind for organizations, and SSM logging is no exception. In the future, we can expect to see more security and compliance enhancements in SSM logging. This includes features such as advanced encryption, access control, and audit logging. These enhancements will help organizations to better protect their logs from unauthorized access, and ensure compliance with regulations such as HIPAA and PCI-DSS.
Conclusion
SSM logging is a powerful tool for monitoring and troubleshooting applications, and it continues to evolve and improve. With trends such as improved analytics and visualization, integration with more AWS services, machine learning and AI, and security and compliance enhancements, SSM logging is becoming even more valuable for organizations. By staying up-to-date with the latest trends and predictions, organizations can leverage SSM logging to its fullest potential, and improve their overall application’s performance and health.


