
Understanding the Basics: What are Power BI and SSRS?
Power BI and SSRS are two popular business intelligence tools developed by Microsoft, designed to help organizations make informed decisions based on data-driven insights. Power BI, a cloud-based solution, is renowned for its modern and interactive data visualization capabilities, enabling users to create compelling and interactive reports. On the other hand, SQL Server Reporting Services (SSRS), a server-based reporting platform, excels in generating comprehensive, pixel-perfect reports with advanced features for large-scale organizations.
Key Differences: Power BI vs SSRS
Power BI and SSRS cater to different needs and use cases within the business intelligence landscape. Power BI, with its emphasis on data visualization and interactivity, is ideal for exploring data, identifying trends, and creating engaging reports to share with various stakeholders. In contrast, SSRS focuses on generating highly customizable, pixel-perfect reports, often used in enterprise-level environments where stringent security and integration with existing systems are crucial.
When comparing Power BI and SSRS, consider the following aspects:
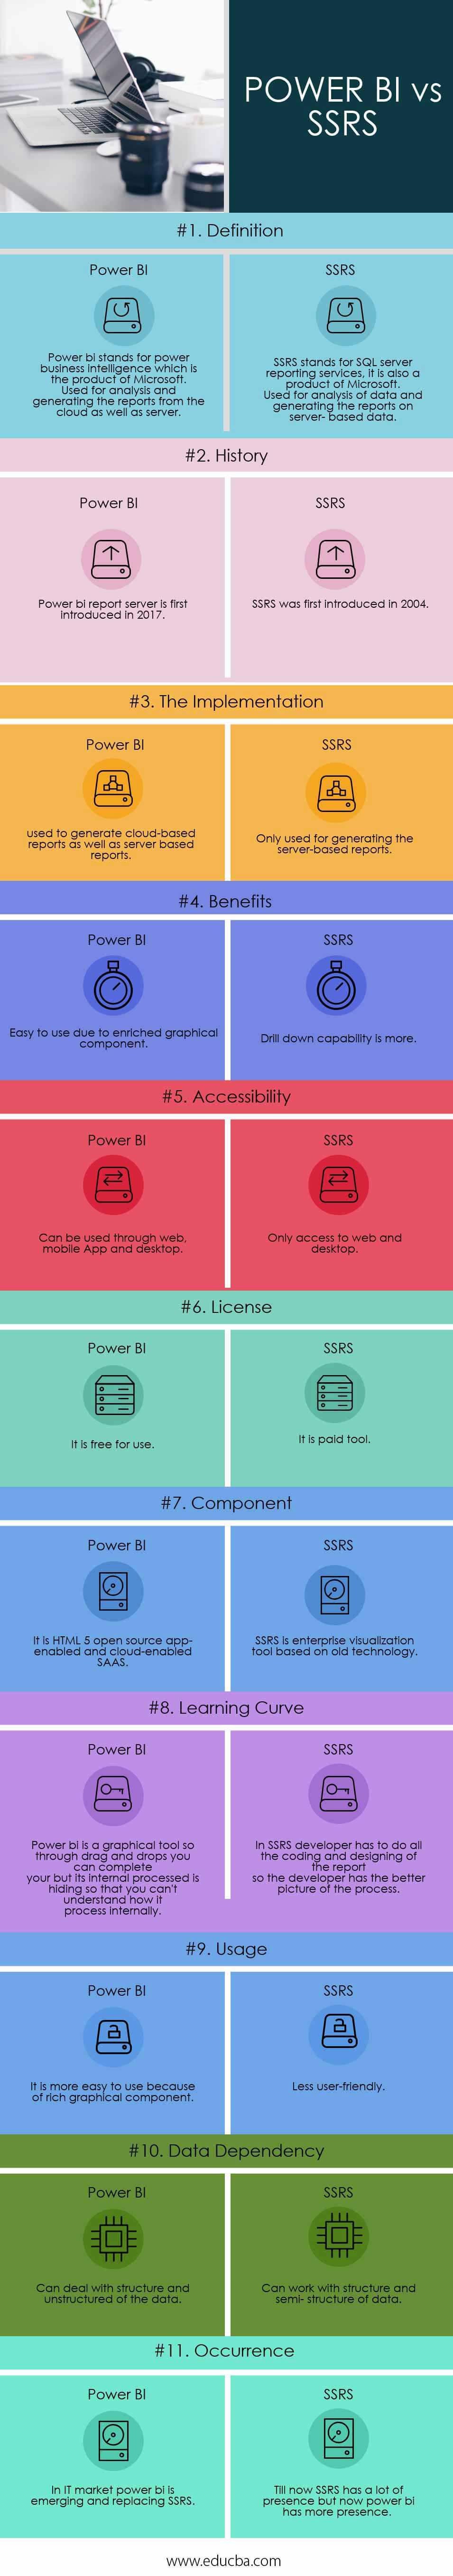
- Data Visualization Capabilities: Power BI offers a wide range of data visualization options, allowing users to create interactive and visually appealing reports. SSRS, while not as visually sophisticated, provides essential charting and formatting options.
- Reporting Functionalities: SSRS excels in generating complex, tabular, and matrix reports, often used in financial, operational, and compliance contexts. Power BI, on the other hand, offers a more interactive and exploratory experience, enabling users to create visualizations and dashboards that update in real-time.
- Ease of Use: Power BI is generally more user-friendly, with a simple and intuitive interface that allows users to create visualizations and reports without extensive technical knowledge. SSRS may require more technical expertise, as it involves designing reports using SQL Server Data Tools or Report Builder.
Power BI: A Modern, Interactive Solution
Power BI is a cutting-edge business intelligence tool that focuses on data visualization and interactivity. Its primary functions and purposes include:
- Connecting to a wide variety of data sources: Power BI supports numerous data sources, including Excel, SQL Server, Oracle, and cloud-based platforms like Salesforce and Google Analytics. This data connectivity enables users to gather, transform, and analyze data from multiple sources, providing a comprehensive view of their organization’s performance.
- Real-time analytics: Power BI offers real-time analytics capabilities, allowing users to monitor and analyze data as it arrives. This feature is particularly useful for time-sensitive decision-making and identifying trends as they emerge.
- Custom visualization options: Power BI provides a vast library of custom visualizations, enabling users to create engaging and interactive reports tailored to their specific needs. These visualizations help users identify patterns, trends, and correlations within their data, facilitating informed decision-making.
- Collaboration and sharing: Power BI allows users to easily share their reports and dashboards with colleagues, both inside and outside their organization. This collaboration feature promotes data-driven discussions and helps ensure that everyone is working with the same information.
- Integration with Microsoft Power Platform: Power BI is part of the Microsoft Power Platform, which includes Power Apps and Power Automate. This integration enables users to build custom applications, automate workflows, and analyze data using a single, cohesive platform.
SSRS: A Robust, Enterprise-Level Reporting Tool
SQL Server Reporting Services (SSRS) is a powerful reporting platform designed for enterprise-level organizations. Its primary functions and purposes include:
- Robust reporting functionalities: SSRS offers a wide range of reporting features, including tabular, matrix, and free-form reports. These reports can be customized with parameters, subreports, and drill-down actions, providing users with in-depth insights into their data.
- Security features: SSRS includes advanced security features, enabling organizations to control access to reports and data at various levels. These security features ensure that sensitive information remains protected and that only authorized users can view or modify reports.
- Seamless integration with SQL Server: SSRS is tightly integrated with Microsoft SQL Server, allowing users to leverage the power of SQL Server for data storage, management, and analysis. This integration also enables users to create reports based on SQL Server data without the need for additional data connectors or tools.
- Subscriptions and delivery: SSRS allows users to schedule and automate report delivery via email, file share, or web services. This feature ensures that stakeholders receive timely, relevant information, without the need to manually generate or distribute reports.
- Data Alerts: SSRS enables users to set up data alerts, which notify them when specific conditions or thresholds are met. This feature helps users stay informed about critical data changes and facilitates proactive decision-making.

Choosing the Right Tool: Factors to Consider
When deciding between Power BI and SSRS, consider the following factors:
- Organization size and complexity: Larger, more complex organizations may benefit from SSRS’s robust reporting functionalities, security features, and seamless integration with SQL Server. Smaller organizations or teams may find Power BI’s ease of use and modern data visualization capabilities more suitable for their needs.
- Data sources: Both Power BI and SSRS support a wide range of data sources. However, Power BI’s connectors for cloud-based platforms like Salesforce and Google Analytics may be more appealing for organizations that rely heavily on these services.
- User skill levels: Power BI’s intuitive interface and user-friendly design make it accessible for users with varying skill levels. SSRS, on the other hand, may require more technical expertise, as it involves designing reports using SQL Server Data Tools or Report Builder.
- Visualization requirements: Organizations that prioritize data visualization and interactivity may find Power BI’s custom visualization options and real-time analytics more appealing. Those focused on generating complex, tabular, and matrix reports may prefer SSRS’s advanced reporting features.
- Budget: Power BI is available in both free and premium versions, while SSRS is typically included with SQL Server licenses. Consider the organization’s budget and the features required when deciding between these tools.

Real-World Applications: Case Studies and Examples
Power BI and SSRS have been successfully implemented in various industries, providing valuable insights and streamlining reporting processes. Here are a few examples:
Power BI Case Study: Retail Industry
A large retail company used Power BI to analyze sales data from multiple sources, including in-store transactions and online sales. By integrating these data sources and creating interactive visualizations, the company identified trends in customer preferences, enabling them to optimize inventory management and marketing strategies.
SSRS Case Study: Healthcare Industry
A healthcare organization implemented SSRS to generate complex reports on patient data, compliance metrics, and financial performance. By leveraging SSRS’s robust reporting functionalities and security features, the organization ensured that sensitive patient information remained protected while providing stakeholders with timely, relevant insights.
Power BI and SSRS Case Study: Manufacturing Industry
A manufacturing company utilized both Power BI and SSRS to address different aspects of their business intelligence needs. Power BI was used to create interactive dashboards for real-time monitoring of production lines, while SSRS generated detailed, customized reports for management and compliance purposes. This combined approach allowed the company to improve operational efficiency and maintain regulatory compliance.
How to Get Started: Implementing Power BI and SSRS
To begin implementing Power BI and SSRS, follow these steps:
Learning Resources
Microsoft offers extensive documentation, tutorials, and learning paths for both Power BI and SSRS. Familiarize yourself with the fundamentals of each tool and explore advanced features as needed.
Installation Procedures
For Power BI, sign up for a free or premium account on the Power BI website. For SSRS, install SQL Server and enable the Reporting Services feature during setup. Ensure that your system meets the necessary hardware and software requirements before installation.
Best Practices for Implementation
- Define your objectives and requirements before implementing either tool. This will help you choose the right features and configurations for your specific needs.
- Consider integrating Power BI and SSRS with other Microsoft tools, such as SharePoint, Excel, and Power Automate, to create a cohesive business intelligence ecosystem.
- Test your implementations in a controlled environment before deploying them to production. This will help you identify and resolve any issues that may arise during the implementation process.
- Establish governance policies and guidelines to ensure the secure and efficient use of Power BI and SSRS within your organization.
- Provide training and support for users to help them make the most of Power BI and SSRS features and capabilities.
Future Trends: The Evolution of Power BI and SSRS
As business intelligence continues to evolve, Power BI and SSRS will adapt to meet the changing needs of organizations. Here are some future trends and developments to watch:
Enhanced Artificial Intelligence and Machine Learning Capabilities
Both Power BI and SSRS are expected to incorporate more advanced AI and machine learning features, enabling users to perform predictive analytics, identify trends, and make data-driven decisions with greater accuracy and speed.
Integration with Internet of Things (IoT) Devices
As IoT devices become increasingly prevalent, Power BI and SSRS may expand their connectivity options to include real-time data streams from these devices. This integration will allow organizations to analyze and act on IoT data more effectively.
Improved Natural Language Processing
Natural language processing capabilities in Power BI and SSRS are likely to become more sophisticated, enabling users to interact with data and generate reports using conversational language. This development will make business intelligence tools more accessible and user-friendly for a wider audience.
Tighter Integration with Microsoft Power Platform
Microsoft is expected to continue integrating Power BI and SSRS with its Power Platform, which includes Power Apps and Power Automate. This integration will create a seamless end-to-end business process automation and data analysis experience for users.
Expanded Cloud Support
As more organizations migrate their business intelligence tools to the cloud, Power BI and SSRS will likely expand their cloud support and capabilities. This expansion will include enhanced security features, scalability, and real-time analytics options.
