What is Power BI and How Can It Help Your Business?
Power BI is a powerful business intelligence tool developed by Microsoft that enables users to visualize and analyze data in a comprehensive and interactive manner. As a cloud-based solution, Power BI is compatible with various platforms and data sources, making it an essential asset for data-driven decision-making. With Power BI, businesses can connect to multiple data sources, including Excel, SQL Server, Salesforce, and more, and create custom visualizations that help them make sense of their data.
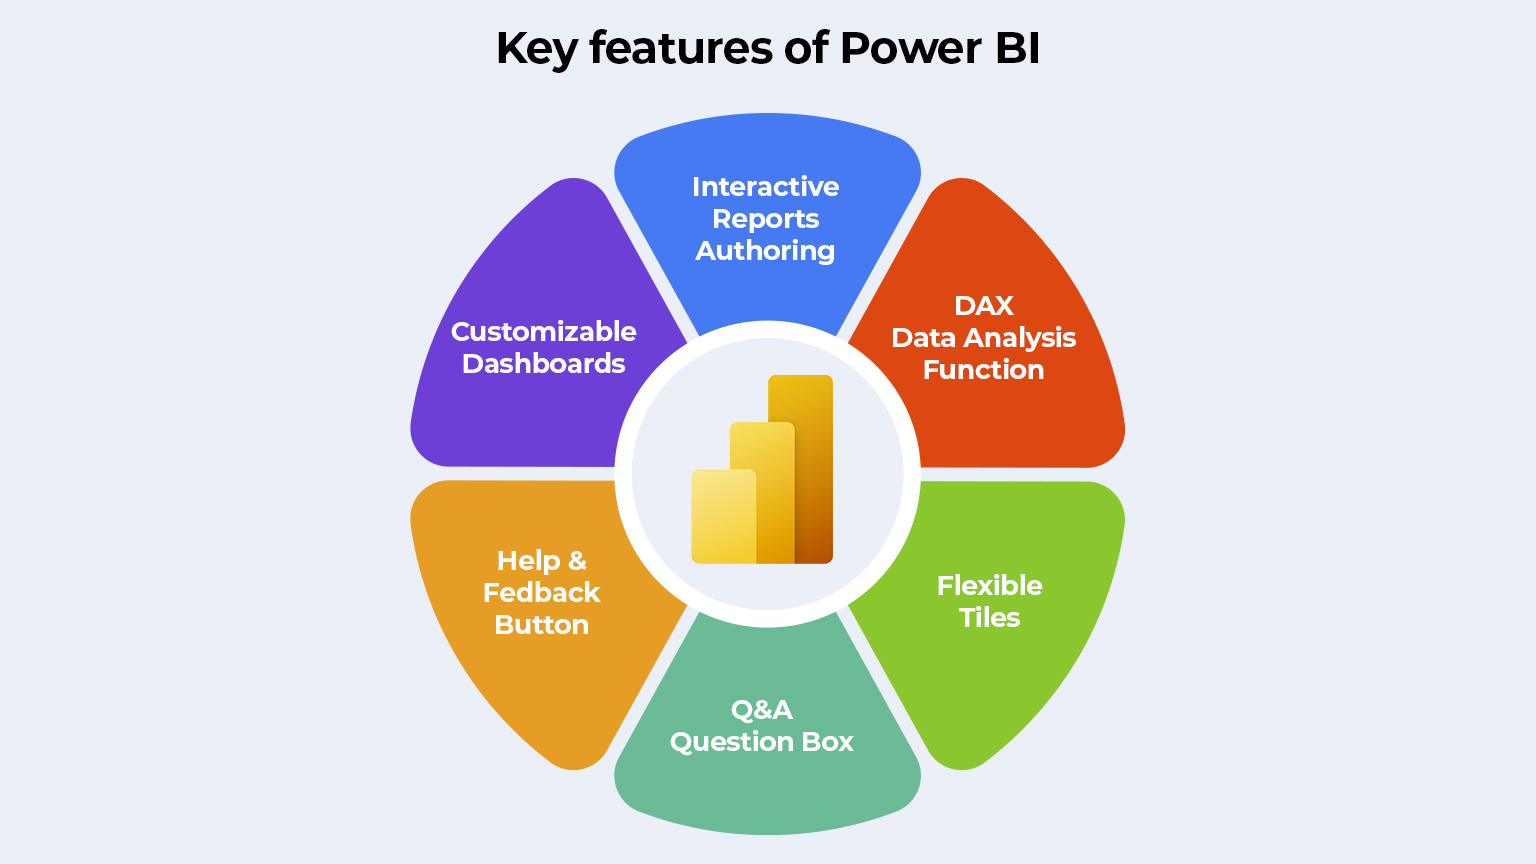
Power BI offers a wide range of features and capabilities that cater to different user needs. Its data modeling capabilities allow users to create complex data models, while its custom visualizations enable users to create interactive and engaging reports. Power BI also offers natural language processing capabilities, making it easy for users to ask questions about their data and get answers in real-time.
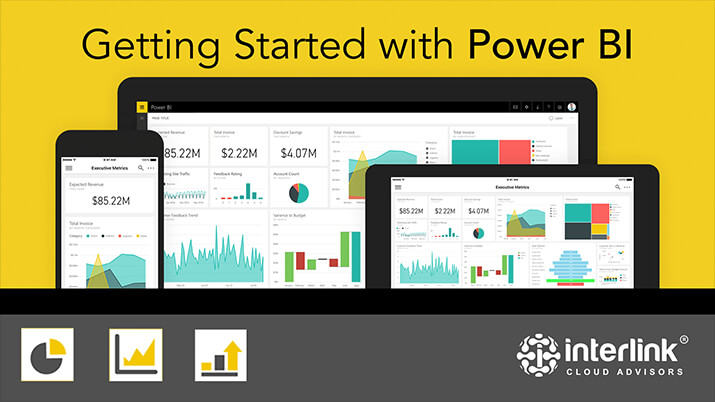
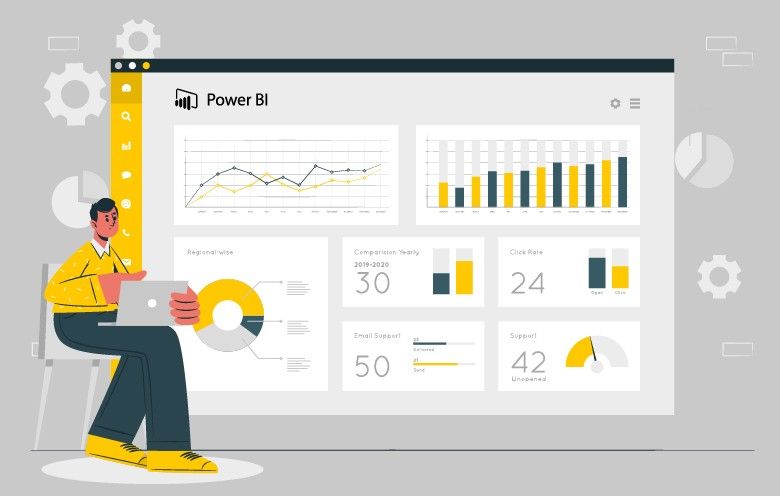
Moreover, Power BI’s ability to create interactive reports and dashboards makes it an ideal tool for businesses looking to monitor and analyze their performance in real-time. With Power BI, businesses can create custom reports and dashboards that provide real-time insights into their operations, enabling them to make informed decisions quickly and effectively. Power BI also offers predictive analytics capabilities, allowing businesses to forecast future trends and identify potential opportunities or risks.
Key Features and Capabilities of Power BI
Power BI is a robust business intelligence tool that offers a wide range of features and capabilities. One of its primary features is data modeling, which allows users to create complex data models that can handle large volumes of data. With Power BI, users can easily transform and shape their data, creating relationships between different data sources and entities. This enables users to create more accurate and insightful reports and dashboards.
Another key feature of Power BI is its custom visualizations. Power BI offers a wide range of built-in visualizations, including charts, graphs, and maps, that users can use to represent their data. However, Power BI also allows users to create custom visualizations, enabling them to create more engaging and interactive reports. This is particularly useful for businesses that want to create unique and customized reports that cater to their specific needs.
Power BI also offers natural language processing capabilities, making it easy for users to ask questions about their data and get answers in real-time. With Power BI, users can type in questions using natural language, and Power BI will automatically generate visualizations that answer those questions. This makes it easy for users to explore their data and uncover insights without needing to have advanced data analysis skills.
Power BI’s ability to create interactive reports and dashboards is another key feature. With Power BI, users can create custom reports and dashboards that provide real-time insights into their operations. These reports and dashboards can be customized to cater to different user needs, and they can be accessed from anywhere, at any time, using Power BI’s cloud-based platform. Power BI also offers predictive analytics capabilities, allowing businesses to forecast future trends and identify potential opportunities or risks.
How to Get Started with Power BI: A ‘Hands-On’ Approach
Getting started with Power BI is a straightforward process. Here is a step-by-step guide to help you get started:
-
Create a Power BI account: To get started with Power BI, you need to create a Power BI account. You can sign up for a free trial or choose one of the paid plans that suit your needs.
-
Connect to data sources: Power BI supports a wide range of data sources, including Excel, SQL Server, Salesforce, and more. To start using Power BI, you need to connect to a data source. This process involves specifying the data source and providing the necessary credentials.
-
Create visualizations: Once you have connected to a data source, you can start creating visualizations. Power BI offers a wide range of built-in visualizations, including charts, graphs, and maps. You can also create custom visualizations using the Power BI Visualizations library.
-
Create reports and dashboards: After creating visualizations, you can create reports and dashboards. Reports are collections of visualizations that provide insights into specific areas of your business. Dashboards are collections of reports that provide a high-level view of your business.
-
Collaborate and share: Power BI makes it easy to collaborate and share reports and dashboards with your team. You can publish reports to the Power BI service, where they can be accessed by anyone with the necessary permissions.
Power BI offers two versions: Power BI Free and Power BI Pro. Power BI Free is a free version that offers basic features, while Power BI Pro is a paid version that offers advanced features, such as real-time data streaming, collaboration, and data modeling.
Real-World Applications of Power BI: Success Stories and Case Studies
Power BI has been successfully implemented by businesses across various industries, helping them to make data-driven decisions and improve their overall performance. Here are some success stories and case studies that highlight the benefits of using Power BI:
Case Study 1: Retail Industry
A leading retail company used Power BI to gain insights into their sales data, inventory levels, and customer behavior. By integrating data from various sources, including their e-commerce platform, CRM system, and in-store sales data, the company was able to create interactive reports and dashboards that provided real-time insights into their business. This helped them to optimize their inventory levels, improve their sales performance, and enhance their customer experience.
Case Study 2: Healthcare Industry
A healthcare provider used Power BI to monitor and analyze patient data, including vital signs, medication orders, and lab results. By integrating data from various sources, including electronic health records, medical devices, and lab systems, the provider was able to create interactive reports and dashboards that provided real-time insights into their patients’ health. This helped them to improve patient outcomes, reduce readmissions, and enhance their overall quality of care.
Case Study 3: Manufacturing Industry
A manufacturing company used Power BI to monitor and analyze their production data, including machine performance, downtime, and throughput. By integrating data from various sources, including sensors, machines, and production systems, the company was able to create interactive reports and dashboards that provided real-time insights into their production process. This helped them to optimize their production process, reduce downtime, and improve their overall efficiency.
These success stories and case studies demonstrate the power of Power BI in helping businesses to make data-driven decisions and improve their overall performance. By integrating data from various sources, creating interactive reports and dashboards, and providing real-time insights, Power BI can help businesses to gain a competitive edge and achieve their goals in data-driven decision-making.
Comparing Power BI with Competitors: Tableau, QlikView, and More
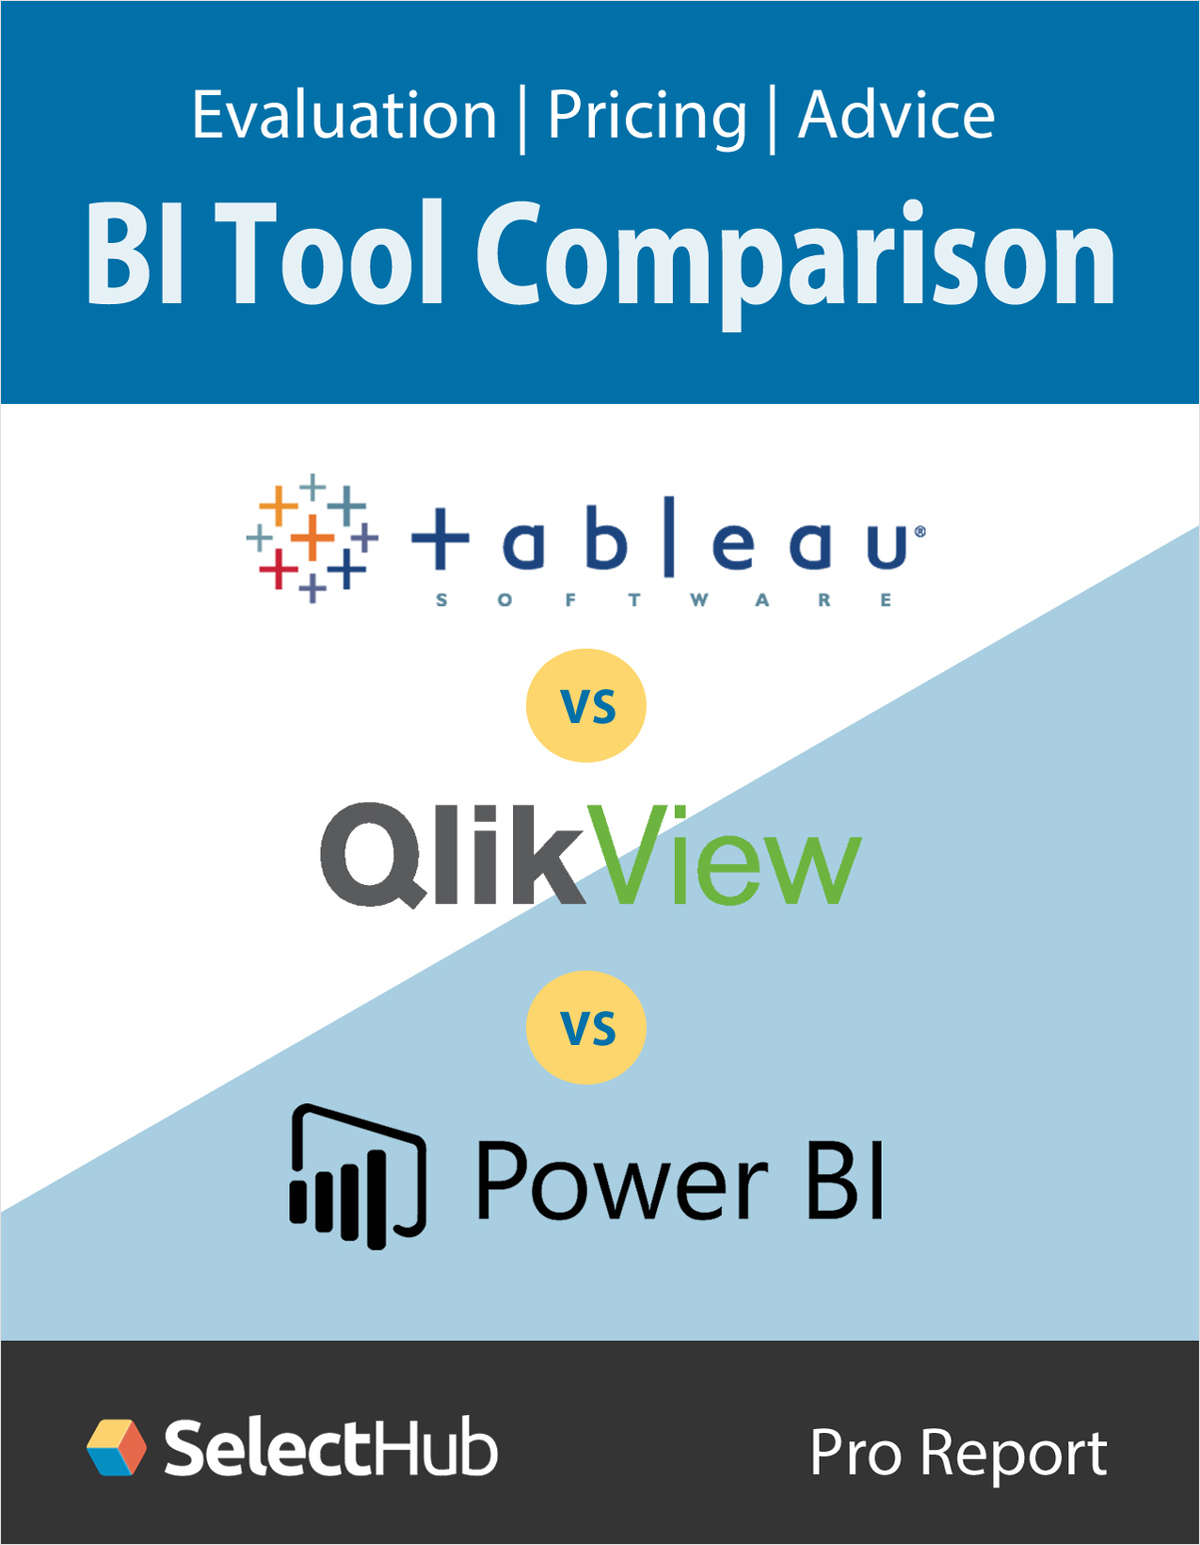
Power BI is not the only business intelligence tool available in the market. There are several other tools, such as Tableau and QlikView, that offer similar features and capabilities. Here’s a comparison of Power BI with its competitors in terms of features, pricing, and ease of use:
Power BI vs. Tableau
Both Power BI and Tableau are popular business intelligence tools that offer similar features and capabilities. However, Power BI has an edge over Tableau in terms of pricing and ease of use. Power BI offers a free version, while Tableau does not. Power BI is also easier to use than Tableau, with a more intuitive user interface and drag-and-drop functionality.
Power BI vs. QlikView
Power BI and QlikView are both powerful business intelligence tools that offer advanced features, such as data modeling and predictive analytics. However, Power BI has an edge over QlikView in terms of pricing and ease of use. Power BI is more affordable than QlikView and offers a more intuitive user interface, making it easier to use for non-technical users.
Other Competitors
Other competitors of Power BI include tools such as Looker, Sisense, and Domo. While these tools offer similar features and capabilities, they differ in terms of pricing, ease of use, and specific use cases. For example, Looker is a popular tool for data discovery and exploration, while Sisense is known for its ability to handle large volumes of data.
When choosing a business intelligence tool, it’s essential to consider your specific needs and requirements. Factors such as pricing, ease of use, features, and specific use cases should be taken into account. While Power BI has several strengths, such as its compatibility with various platforms and data sources, custom visualizations, and natural language processing, it may not be the best fit for every business. It’s essential to compare Power BI with its competitors and choose the tool that best meets your needs and requirements.
Best Practices for Using Power BI: Tips and Tricks for Success
Power BI is a powerful business intelligence tool, but to get the most out of it, it’s essential to follow best practices for using it. Here are some tips and tricks for success:
Data Governance
Data governance is crucial when using Power BI. It involves managing and ensuring the quality, security, and accessibility of data. To practice good data governance, it’s essential to establish data policies, procedures, and standards. This includes defining data ownership, establishing data access controls, and ensuring data accuracy and consistency.
Security
Security is another critical aspect of using Power BI. It’s essential to ensure that sensitive data is protected and that only authorized users have access to it. Power BI offers several security features, such as row-level security, which allows you to restrict access to specific rows in a table based on user roles and permissions.
Collaboration
Collaboration is essential in today’s business environment. Power BI offers several collaboration features, such as sharing dashboards and reports with other users, enabling real-time collaboration and feedback. It’s essential to establish collaboration policies and procedures to ensure that data is shared and used appropriately.
Optimizing Performance
Optimizing Power BI performance is crucial for ensuring fast and efficient data analysis. To optimize Power BI performance, it’s essential to minimize the use of complex visualizations, limit the number of data sources, and use appropriate data modeling techniques. It’s also essential to monitor Power BI performance regularly and make adjustments as needed.
Data Accuracy and Consistency
Data accuracy and consistency are essential for making informed business decisions. To ensure data accuracy and consistency, it’s essential to establish data quality standards, perform regular data audits, and use appropriate data validation techniques. Power BI offers several data validation features, such as data validation rules and conditional formatting, which can help ensure data accuracy and consistency.
By following these best practices, businesses can ensure that they are using Power BI effectively and efficiently, maximizing its potential for data-driven decision-making. It’s essential to establish policies, procedures, and standards for using Power BI and to monitor its usage regularly to ensure that it meets the business’s needs and requirements.
The Future of Power BI: Trends and Innovations to Watch Out For
Power BI is a constantly evolving business intelligence tool, and it’s essential to stay up-to-date with the latest trends and innovations. Here are some trends and innovations to watch out for in Power BI:
Artificial Intelligence and Machine Learning
Artificial intelligence (AI) and machine learning (ML) are becoming increasingly important in business intelligence. Power BI is leveraging advancements in AI and ML to provide more sophisticated and intelligent data analysis. For example, Power BI offers features such as automated machine learning, which allows users to build machine learning models without needing advanced data science skills.
Real-Time Analytics
Real-time analytics is becoming increasingly important for businesses that need to make quick and informed decisions. Power BI offers real-time analytics capabilities, allowing users to monitor and analyze data in real-time. This is particularly useful for businesses that need to monitor fast-moving data, such as social media data or sensor data.
Integration with Other Microsoft Products
Power BI is part of the Microsoft Power Platform, which includes other products such as Power Apps and Power Automate. Power BI is increasingly being integrated with these other products, allowing businesses to create end-to-end solutions that cover everything from data analysis to automation and application development.
Data Privacy and Security
Data privacy and security are becoming increasingly important in business intelligence. Power BI is addressing these concerns by offering features such as data privacy level controls, which allow users to control who can access specific data. Power BI is also compliant with various data privacy regulations, such as the General Data Protection Regulation (GDPR) and the California Consumer Privacy Act (CCPA).
Natural Language Processing
Natural language processing (NLP) is becoming increasingly important in business intelligence, allowing users to interact with data using natural language queries. Power BI offers NLP capabilities, allowing users to ask questions about their data using natural language queries. This makes it easier for non-technical users to interact with data and perform analysis.
By staying up-to-date with these trends and innovations, businesses can ensure that they are using Power BI to its full potential and leveraging the latest advancements in business intelligence and data analytics. It’s essential to monitor Power BI’s development regularly and make adjustments as needed to ensure that it meets the business’s needs and requirements.
Conclusion: Is Power BI Right for Your Business?
Power BI is a powerful business intelligence tool that can help businesses unlock insights from their data, enabling them to make data-driven decisions. With its compatibility with various platforms and data sources, primary features such as data modeling, custom visualizations, and natural language processing, and the ability to create interactive reports and dashboards, Power BI is a versatile tool that can cater to different user needs.
Setting up and using Power BI is relatively straightforward, with a free and paid version available, each with its respective features. Real-world applications of Power BI have shown significant improvements in business performance, making it a valuable asset for data-driven decision-making.
Comparing Power BI with competitors such as Tableau and QlikView, Power BI holds its own in terms of features, pricing, and ease of use. While each tool has its strengths and weaknesses, Power BI caters well to different user needs, providing a comprehensive solution for businesses looking to leverage their data.
Best practices for using Power BI include data governance, security, and collaboration, with tips on how to optimize Power BI for performance and ensure data accuracy and consistency. The future of Power BI looks promising, with emerging trends and innovations in business intelligence and data analytics, leveraging advancements in artificial intelligence and machine learning.
In conclusion, Power BI is a suitable choice for businesses looking to make data-driven decisions. While there may be potential drawbacks, such as the learning curve associated with any new tool, the benefits of using Power BI far outweigh the drawbacks. By following best practices and staying up-to-date with the latest trends and innovations, businesses can leverage Power BI to achieve their goals in data-driven decision-making.


