What is Power BI and Why Get Started?
Power BI is a robust business analytics tool developed by Microsoft, designed to provide interactive visualizations and powerful business intelligence capabilities. The primary function of Power BI is to transform raw data into meaningful insights, enabling data-driven decision-making and fostering business growth. By getting started with Power BI, users can:
- Easily connect to various data sources, including Excel, CSV, SQL Server, and online services.
- Clean, transform, and shape data using the intuitive Power Query Editor.
- Create visually appealing and informative reports and dashboards to present key performance indicators (KPIs) and trends.
- Implement interactive features, such as buttons and bookmarks, to facilitate user engagement and exploration.
- Collaborate with colleagues and manage access levels for secure sharing of Power BI content.
- Stay up-to-date with new features and capabilities through continuous learning and community engagement.
In essence, Power BI is an indispensable tool for organizations seeking to harness the potential of their data and drive success in today’s data-centric world. Getting started with Power BI is a crucial step towards unlocking the true potential of your business data.

Preparing for Your Power BI Adventure: System Requirements and Installation
Before diving into the world of Power BI, it is essential to ensure that your system meets the necessary requirements and that you have the correct version installed. Power BI is compatible with Windows 10, Windows 8.1, and Windows Server 2016 or later. The following guidelines will help you download, install, and activate Power BI Desktop:
- Visit the official Microsoft Power BI website to download the Power BI Desktop application.
- Run the downloaded installer and follow the on-screen instructions to install Power BI Desktop on your system.
- Launch Power BI Desktop and sign in using your Microsoft account credentials.
- Choose between the free and pro versions of Power BI, depending on your needs and requirements.
Power BI Desktop is available in two versions: a free version and a pro version. The free version offers basic data modeling, visualization, and reporting capabilities, while the pro version provides advanced features, such as collaboration, data refresh scheduling, and the ability to publish reports to the Power BI service.
To upgrade from the free version to the pro version, users can purchase a Power BI Pro license through the Microsoft 365 admin center or through a Microsoft partner. By getting started with Power BI, users can harness the power of data-driven decision-making and unlock the true potential of their business data.

Navigating the Power BI Interface: A Gentle Introduction
The Power BI Desktop interface is designed to be intuitive and user-friendly, allowing users to easily navigate and access various features. Key areas of the Power BI Desktop interface include:
- Home tab: The Home tab provides quick access to essential functions, such as creating new reports, accessing recent files, and applying common visualizations.
- Report view: Report view is where users can create, design, and customize reports using various visualizations and formatting options.
- Data view: Data view allows users to view, clean, and transform raw data using the Power Query Editor before visualizing it in reports.
- Model view: Model view enables users to create and manage relationships between data tables, ensuring accurate and meaningful data analysis.
Understanding the Power BI Desktop interface is crucial for users to effectively create, customize, and share reports and dashboards. Familiarity with these key areas will empower users to harness the full potential of Power BI and drive data-driven decision-making in their organizations.
Connecting to Data Sources: A Crucial First Step
Connecting Power BI to various data sources is a fundamental step in creating insightful reports and dashboards. Power BI supports a wide range of data sources, including:
- Microsoft Excel
- CSV files
- SQL Server databases
- Online services, such as Salesforce, Dynamics 365, and Google Analytics
To connect Power BI to a data source, follow these steps:
- Launch Power BI Desktop and click on Home > Get Data in the top ribbon.
- Select the desired data source from the list of available options. For this example, we will use Excel.
- Browse to the location of your Excel file and click Open.
- Enter your credentials, if required, and click Connect.
- Navigate to the table or data range you wish to use and click Load.
Once the data is loaded, you can begin cleaning, transforming, and visualizing it using Power BI’s powerful features. Connecting to data sources is a crucial first step in your Power BI journey, as it lays the foundation for creating impactful reports and dashboards that drive data-driven decision-making in your organization.
Transforming Data with Power Query Editor
Power Query Editor is a powerful data transformation tool integrated into Power BI. It enables users to clean, transform, and shape data to fit their reporting needs. With an intuitive user interface and a wide range of capabilities, Power Query Editor simplifies the data preparation process.
To access Power Query Editor, follow these steps:
- Launch Power BI Desktop and click on Home > Edit Queries in the top ribbon.
- Power Query Editor will open, displaying the Query Settings pane on the right side and the Preview pane on the left.
Some common data transformation tasks in Power Query Editor include:
- Removing columns: To remove a column, right-click on the column header and select Remove.
- Renaming columns: To rename a column, double-click on the column header and type the new name.
- Changing data types: To change the data type of a column, click on the Data Type dropdown in the Column Tools tab and select the desired data type.
- Filtering data: To filter data, click on the dropdown arrow in the column header and select the desired filter options.
- Grouping data: To group data, click on the Transform tab and select Group By. Configure the grouping settings and click OK.
Power Query Editor offers numerous other transformation options, such as merging queries, splitting columns, pivoting and unpivoting data, and calculating new columns based on existing data. Mastering Power Query Editor is essential for users looking to get the most out of Power BI and create accurate, insightful reports.
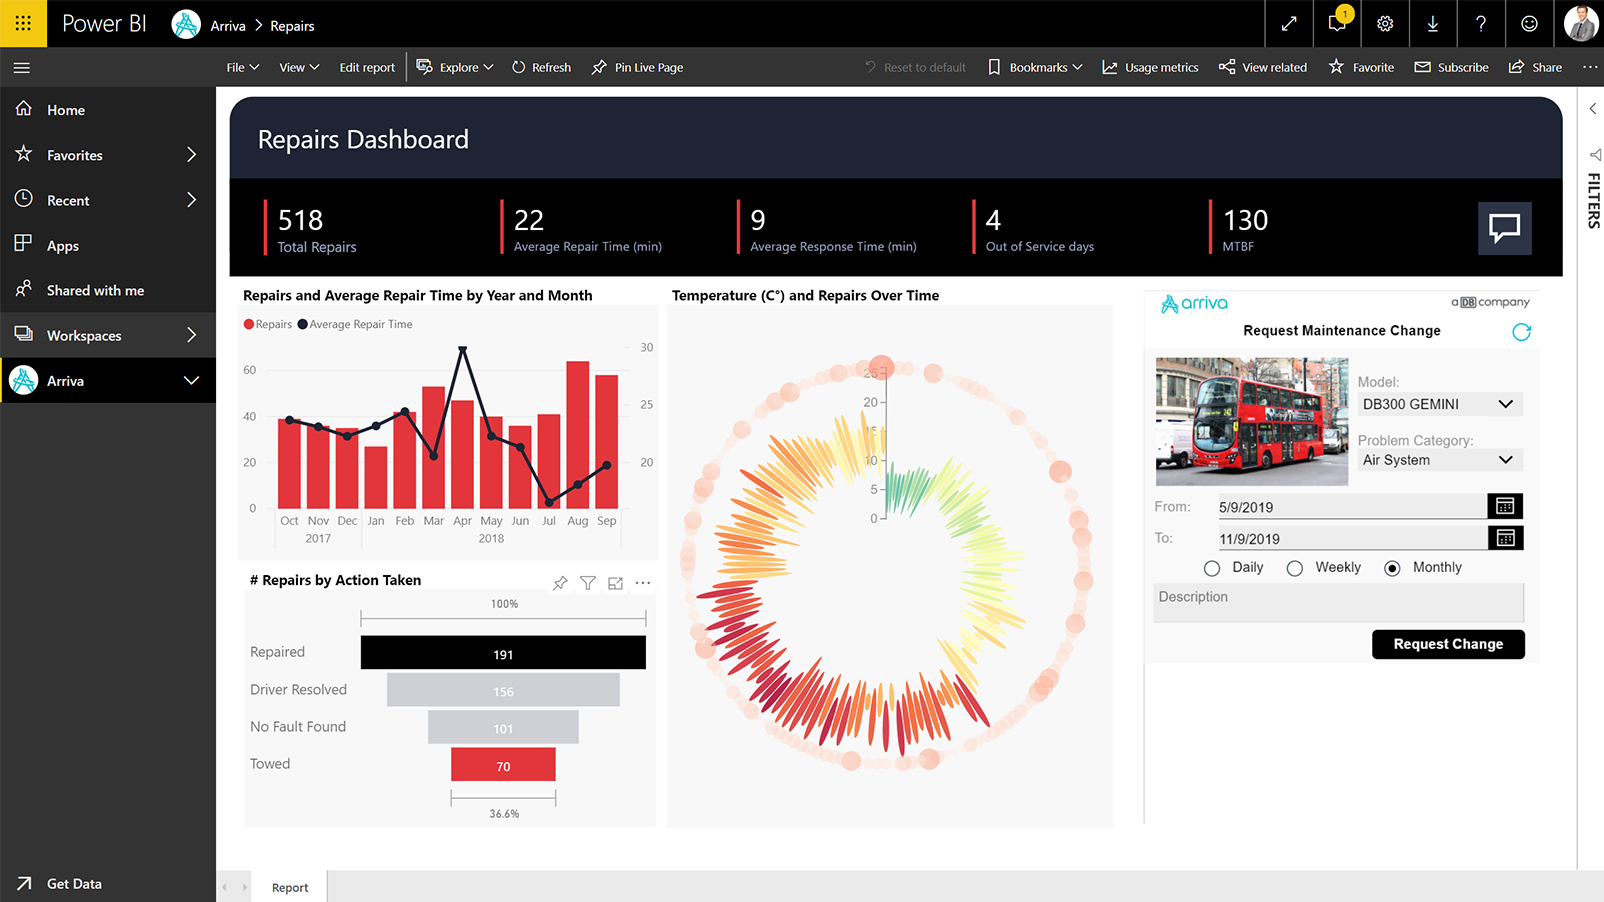
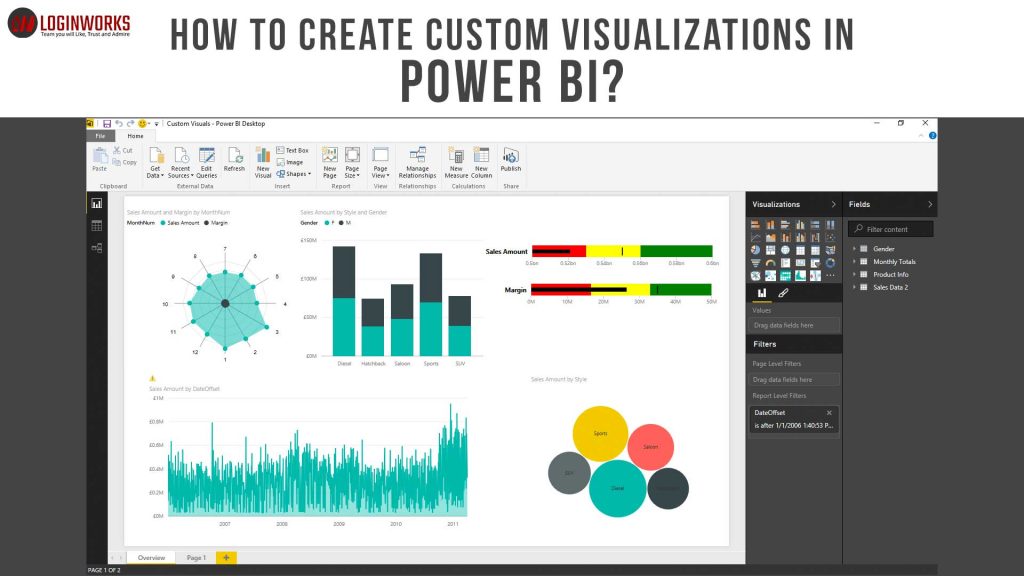
Creating Your First Power BI Report: Visualizations and Interactivity
Power BI reports enable users to present data in a visually appealing and interactive format, making it easy to identify trends, patterns, and insights. To create your first Power BI report, follow these steps:
- Launch Power BI Desktop and click on Home > Report in the top ribbon.
- Add visualizations to the report canvas by clicking on the Visualizations pane and selecting the desired visual.
- Add data fields to the visual by dragging and dropping them from the Fields pane onto the appropriate sections of the visual.
Formatting visuals is an essential aspect of creating engaging and informative Power BI reports. To format a visual, click on the Format button in the Visualizations pane and customize the visual’s appearance as desired.
Interactivity is another powerful feature of Power BI reports. Users can implement interactivity using buttons and bookmarks. Buttons allow users to trigger actions, such as filtering or highlighting data, while bookmarks enable users to save specific report states and quickly navigate between them.
To add a button, click on the Insert tab in the top ribbon and select Button. Configure the button’s action and formatting as desired. To create a bookmark, click on the View tab and select Bookmarks. Click on Add to create a new bookmark and provide a name for it.
By mastering the art of creating visually appealing and interactive Power BI reports, users can effectively communicate data insights and drive informed decision-making in their organizations.
Sharing Your Power BI Dashboard: Collaboration and Access
Sharing Power BI dashboards with colleagues is an essential aspect of collaboration and data-driven decision-making. Power BI offers several options for sharing dashboards, including:
- Sharing with specific users: To share a dashboard with specific users, click on the Share button in the top ribbon and enter the email addresses of the intended recipients. You can also set access levels, such as view or edit, for each user.
- Publishing to the web: Power BI allows users to publish dashboards to the web, making them accessible to anyone with the link. This option is suitable for sharing dashboards with a broader audience, such as clients or external stakeholders.
- Embedding in a website or application: Power BI also supports embedding dashboards in websites or applications, enabling seamless integration with existing systems and workflows.
When sharing Power BI dashboards, it is crucial to consider data security and best practices. Ensure that sensitive data is protected by setting appropriate access levels and sharing only with trusted individuals. Additionally, regularly review and update sharing permissions to maintain data security and ensure that only the necessary users have access to the dashboard.
By mastering the art of sharing Power BI dashboards, users can foster collaboration, promote data-driven decision-making, and drive business growth.

Continuous Learning and Power BI Resources
As a user of Power BI, continuous learning is essential to stay up-to-date with new features, capabilities, and best practices. Numerous resources are available to help users expand their Power BI knowledge and skills, including:
- Official Power BI documentation: Microsoft provides comprehensive documentation on all aspects of Power BI, from getting started to advanced features and customization options. The documentation is an excellent resource for users looking to deepen their understanding of Power BI and its capabilities.
- Power BI community forums: The Power BI community forums offer a platform for users to connect, share ideas, and ask questions. By participating in the forums, users can learn from experienced Power BI professionals and stay informed about the latest developments in the Power BI ecosystem.
- Online training courses: Various online platforms, such as Udemy, Coursera, and LinkedIn Learning, offer Power BI training courses. These courses cater to users with different skill levels and cover a wide range of topics, from basic data visualization to advanced data modeling and customization.
- Power BI blogs and websites: Several blogs and websites focus on Power BI, providing tutorials, case studies, and best practices. Examples include the Power BI Blog and the Power BI Guides by SQLBI.
By leveraging these resources, Power BI users can stay informed about new features, improve their skills, and drive innovation in their organizations. Continuous learning is crucial for users looking to get the most out of Power BI and stay ahead in the ever-evolving world of business analytics.