
Understanding the Power BI Filter Pane: A Comprehensive Guide
The Power BI filter pane is an essential feature in the data analysis process, allowing users to interactively filter and explore data within their visualizations. Customizing and effectively utilizing the filter pane can significantly enhance the user experience and streamline the data analysis process. This guide offers an in-depth look at the Power BI filter pane, its purpose, and its significance in modern data analysis.
The Power BI filter pane serves as a centralized location for users to apply filters to their data, enabling them to focus on specific subsets of information and gain deeper insights. By customizing the filter pane, users can tailor their data analysis experience to their unique needs and requirements. This customization can include adding or removing filters, rearranging the layout, and applying various formatting options to improve clarity and readability.
Effective utilization of the Power BI filter pane can lead to several benefits, such as increased efficiency, enhanced data exploration, and improved decision-making capabilities. By mastering the filter pane, users can unlock the full potential of Power BI and transform their data analysis processes.
How to Customize the Power BI Filter Pane: A Step-by-Step Tutorial
Customizing the Power BI filter pane can significantly enhance the user experience and improve the efficiency of the data analysis process. This step-by-step tutorial will guide you through the process of customizing the Power BI filter pane, including adding and removing filters, rearranging the layout, and applying various formatting options.
Step 1: Adding Filters to the Power BI Filter Pane
To add a filter to the Power BI filter pane, follow these simple steps:
- Select the visualization you wish to add a filter to.
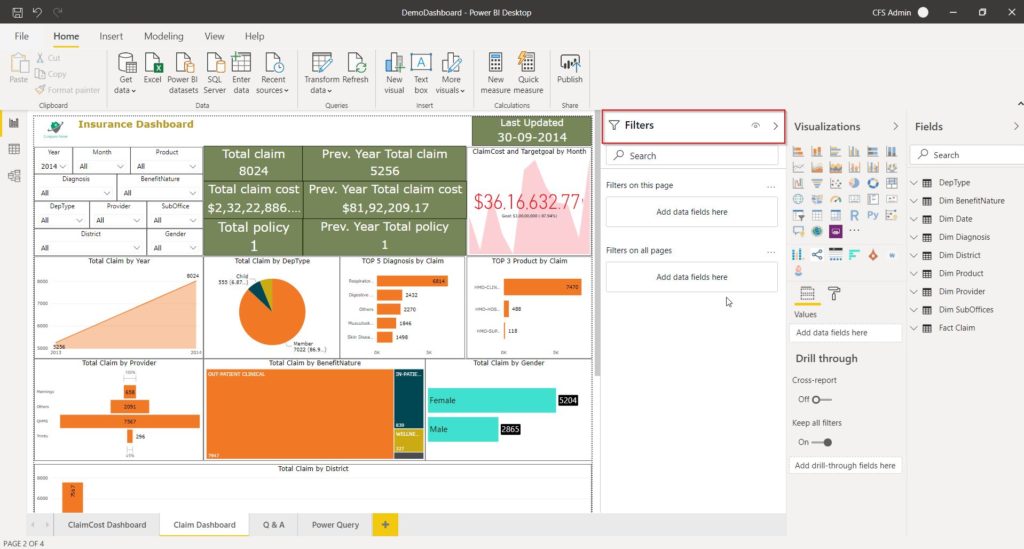
- Click on the ‘Filters’ pane in the ‘Visualizations’ area.
- Choose the field you would like to filter by and apply the desired filter criteria.
Step 2: Removing Filters from the Power BI Filter Pane
To remove a filter from the Power BI filter pane, follow these easy steps:
- Click on the filter you wish to remove in the ‘Filters’ pane.
- Select the ‘Remove filter’ option.
Step 3: Rearranging the Layout of the Power BI Filter Pane
To rearrange the layout of the Power BI filter pane, follow these straightforward steps:
- Click and drag a filter to the desired location within the ‘Filters’ pane.
- Release the filter to finalize the new layout.
Step 4: Applying Formatting Options to the Power BI Filter Pane
To apply formatting options to the Power BI filter pane, follow these easy steps:
- Click on the ‘Format’ button in the ‘Visualizations’ area.
- Expand the ‘Filters’ section.
- Customize the appearance of the filter pane by adjusting the available formatting options, such as background color, font size, and font style.
By following these simple steps, you can effectively customize the Power BI filter pane to suit your unique data analysis needs and requirements.

Maximizing Efficiency: Best Practices for Using the Power BI Filter Pane
Customizing and effectively utilizing the Power BI filter pane can significantly enhance the data analysis experience and improve overall efficiency. By following these best practices, users can optimize their use of the Power BI filter pane and save time in the data analysis process.
Best Practice 1: Organize Filters by Relevance
Organize filters in the Power BI filter pane by relevance to create a logical flow and make it easier for users to find and apply the filters they need. This can be done by grouping related filters together and arranging them in a hierarchical order based on importance or frequency of use.
Best Practice 2: Use Relative Date Slicers
Relative date slicers allow users to dynamically filter data based on a specified time period, such as ‘Last Month’ or ‘This Quarter’. Utilizing relative date slicers can save time and reduce the need for manual updates to the filter pane.
Best Practice 3: Utilize the ‘Search’ Function
The ‘Search’ function in the Power BI filter pane enables users to quickly locate specific filters without scrolling through the entire list. By using the ‘Search’ function, users can save time and streamline the data analysis process.
Best Practice 4: Collapse Filters When Not in Use
Collapsing filters in the Power BI filter pane when they are not in use can help maintain a clean and organized workspace. This can reduce clutter and make it easier for users to focus on the filters and visualizations that are currently relevant to their analysis.
Best Practice 5: Use Filter Card Visibility Options
Power BI offers visibility options for filter cards, allowing users to control which filters are displayed and when. By using these options, users can ensure that the most relevant filters are always visible and easily accessible.
By incorporating these best practices into their data analysis processes, users can maximize the efficiency of their Power BI filter pane and improve their overall experience with the platform.
Real-World Applications: Success Stories of Power BI Filter Pane Implementation
The Power BI filter pane has proven to be an invaluable tool for businesses and professionals seeking to optimize their data analysis processes. By effectively implementing the Power BI filter pane, users can streamline their workflows, save time, and gain deeper insights into their data.
Case Study 1: Sales Department
A sales department within a large organization implemented the Power BI filter pane to enhance their data analysis capabilities. By organizing filters by relevance and using relative date slicers, the sales team was able to quickly and easily filter sales data based on specific criteria, such as region, product, and time period. As a result, the team experienced a significant increase in efficiency and was able to make more informed decisions, leading to improved sales performance.
Case Study 2: Marketing Agency
A marketing agency adopted the Power BI filter pane to better manage and analyze their clients’ campaign data. By utilizing the ‘Search’ function and filter card visibility options, the agency was able to create customized dashboards for each client, allowing them to quickly access the most relevant data and insights. This streamlined workflow resulted in increased client satisfaction and improved campaign performance.
Case Study 3: Financial Services Firm
A financial services firm leveraged the Power BI filter pane to analyze complex financial data and make more informed investment decisions. By using custom filters and bookmarks, the firm’s analysts were able to create detailed, interactive visualizations that allowed them to explore various scenarios and identify trends. This advanced use of the Power BI filter pane led to improved decision-making and increased profitability for the firm.
These success stories demonstrate the significant impact that the Power BI filter pane can have on data analysis processes and business outcomes. By effectively implementing and utilizing the Power BI filter pane, businesses and professionals can unlock the full potential of their data and drive better decision-making.

Comparing the Power BI Filter Pane with Alternative Data Filters
Power BI offers several options for filtering data, including the Power BI filter pane, table filters, and visual-level filters. Understanding the strengths and weaknesses of each option can help users determine when to use each type of filter, ensuring they make the most of their data analysis processes.
Power BI Filter Pane
The Power BI filter pane is a versatile and customizable tool that allows users to filter data at the page or report level. With the ability to add, remove, and rearrange filters, as well as format the pane to suit individual preferences, the Power BI filter pane is an ideal solution for users who require a comprehensive and adaptable filtering experience.
Table Filters
Table filters enable users to filter data directly within a table or matrix visual. These filters are particularly useful when working with large datasets, as they allow users to quickly narrow down the data to specific rows or columns. However, table filters are limited to the visual in which they are applied and do not offer the same level of customization as the Power BI filter pane.
Visual-Level Filters
Visual-level filters apply filters directly to individual visuals, offering users a high degree of control over the data displayed in each visual. While visual-level filters can be useful for fine-tuning the display of specific visuals, they do not offer the same flexibility as the Power BI filter pane and can be more time-consuming to manage, especially when working with multiple visuals.
Recommendations
For users seeking a comprehensive and adaptable filtering experience, the Power BI filter pane is the recommended option. However, there may be situations where table filters or visual-level filters are more appropriate, such as when working with large datasets or when fine-tuning the display of specific visuals. By understanding the strengths and weaknesses of each option, users can make informed decisions about when to use each type of filter, ensuring they make the most of their Power BI experience.

Staying Up-to-Date: Power BI Filter Pane Updates and Enhancements
Microsoft regularly releases updates and enhancements to the Power BI platform, including the filter pane. Staying informed about these changes can help users maximize the potential of their data analysis processes and ensure they are making the most of the features available to them.
Recent Updates
In recent updates, the Power BI filter pane has seen several improvements, including the addition of a ‘Search’ function, which allows users to quickly locate specific filters within the pane. This feature can be particularly useful when working with large datasets or complex reports, as it helps users save time and maintain focus on their analysis.
Performance Improvements
Microsoft has also made significant strides in improving the performance of the Power BI filter pane, with updates focused on reducing load times and increasing the overall speed and responsiveness of the pane. These performance improvements can lead to a more seamless and efficient data analysis experience for users.
Bug Fixes
Regular updates to the Power BI filter pane also include bug fixes, addressing any issues or inconsistencies that may impact users’ data analysis processes. By staying up-to-date with these updates, users can ensure they are working with a stable and reliable platform, minimizing the risk of disruptions or errors in their analysis.
Stay Informed
To stay informed about the latest updates and enhancements to the Power BI filter pane, users can follow the Power BI blog, community forums, and release notes. By engaging with these resources, users can not only stay up-to-date on the latest changes but also provide feedback and contribute to the ongoing development of the Power BI platform.

Troubleshooting Common Issues with the Power BI Filter Pane
While the Power BI filter pane is a powerful and versatile tool, users may occasionally encounter issues or challenges when working with the feature. By understanding common problems and their solutions, users can quickly overcome obstacles and continue refining their data analysis skills.
Issue 1: Filter Pane Not Displaying Correctly
If the Power BI filter pane is not displaying correctly, users can try resetting the pane layout by clicking on the ‘Reset to Default’ button in the ‘Filter Pane’ section of the ‘View’ tab. This action will restore the default layout and may resolve any display issues.
Issue 2: Filters Not Updating Visualizations
If filters are not updating visualizations as expected, users should ensure that the visualizations are based on the correct data fields and that any necessary relationships have been established between tables. Additionally, users can try refreshing the data by clicking on the ‘Refresh’ button in the ‘Home’ tab.
Issue 3: Filter Pane Taking Too Long to Load
If the Power BI filter pane is taking too long to load, users can try reducing the number of filters or visualizations on the page, as large datasets or complex visualizations can slow down the loading process. Additionally, users can ensure that their Power BI service is up-to-date and that their internet connection is stable and fast.
Issue 4: Filter Pane Not Saving Changes
If changes made to the Power BI filter pane are not being saved, users should ensure that they have the necessary permissions to edit the report and that they are saving their changes to the correct version of the report. Additionally, users can try saving the report to a different location or under a different name to see if the issue persists.
Additional Resources
For more information on troubleshooting common issues with the Power BI filter pane, users can consult the Power BI community forums, documentation, and support resources. These resources can provide additional guidance and help users resolve any challenges they may encounter when working with the Power BI filter pane.
Empowering Your Data Analysis: Advanced Techniques for Using the Power BI Filter Pane
Once users have mastered the basics of the Power BI filter pane, they can explore advanced techniques to further enhance their data analysis experience. These advanced features can help users save time, increase efficiency, and unlock deeper insights from their data.
Creating Custom Filters
Power BI allows users to create custom filters based on specific criteria, such as text, numeric, or date ranges. By creating custom filters, users can tailor their data analysis to their unique needs and requirements, ensuring they get the most relevant and actionable insights from their data.
Using Bookmarks
Bookmarks enable users to save specific views of their data, including filters, slicers, and visualizations. By using bookmarks, users can quickly switch between different views of their data, making it easier to compare and contrast different scenarios and identify trends and patterns.
Integrating with Other Power BI Features
The Power BI filter pane can be integrated with other Power BI features, such as drill-through pages, Q&A, and paginated reports, to provide a seamless and cohesive data analysis experience. By integrating these features, users can create more complex and sophisticated data models, enabling them to gain deeper insights and make more informed decisions.
Continuing Education
To continue refining their data analysis skills and making the most of the Power BI filter pane, users should consider engaging in ongoing education and training. Power BI offers a range of resources, including online courses, webinars, and community forums, to help users stay up-to-date on the latest features and best practices.
Conclusion
The Power BI filter pane is a powerful and versatile tool that can help users enhance their data analysis processes and gain deeper insights from their data. By customizing and effectively utilizing the filter pane, users can save time, increase efficiency, and make more informed decisions. By exploring advanced techniques and continuing their education, users can unlock the full potential of the Power BI filter pane and take their data analysis skills to the next level.
