Power BI: A Business Intelligence Powerhouse
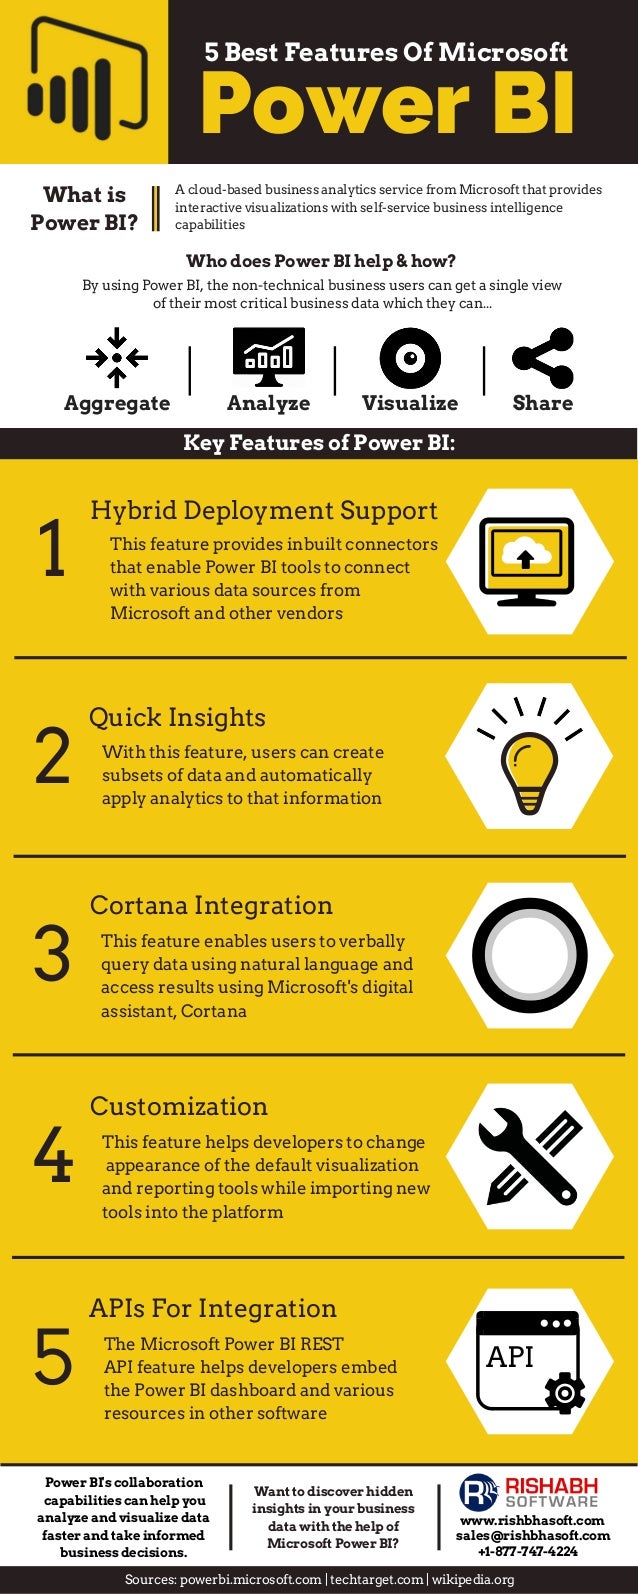
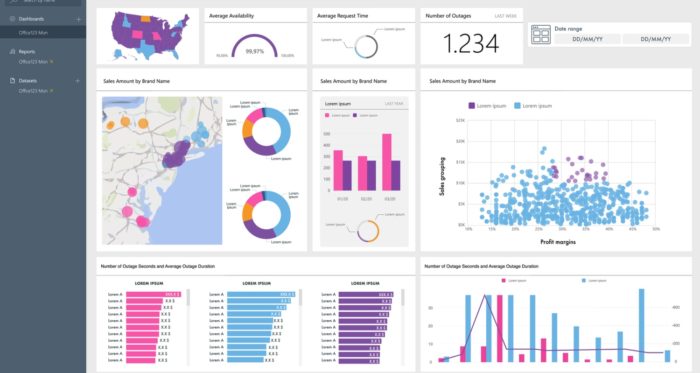
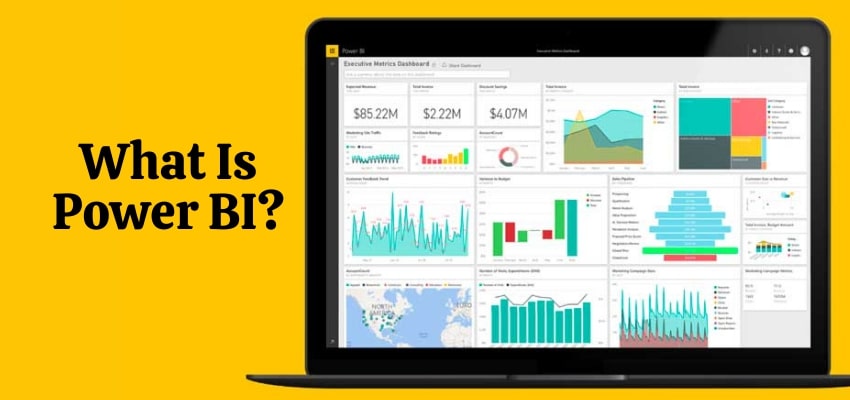
Power BI is a powerful and user-friendly business intelligence tool that enables users to connect to various data sources, perform data analysis, and create interactive visualizations. The primary function of Power BI is to provide a comprehensive platform for data analysis and visualization, allowing businesses and organizations to make informed decisions based on data-driven insights. With its ability to connect to multiple data sources, Power BI can integrate data from different systems and applications, providing a unified view of an organization’s data.
Power BI offers a range of features and capabilities that make it an ideal tool for data analysis and visualization. Its data modeling feature allows users to create complex data models, while its data transformation feature enables users to clean, transform, and shape data to fit their analysis needs. Power BI also offers report creation capabilities, allowing users to create interactive and visually appealing reports that can be shared with stakeholders and decision-makers.
At its core, Power BI is a business intelligence tool that empowers users to analyze and visualize data in a way that is meaningful and insightful. Its ability to connect to various data sources, perform data analysis, and create interactive visualizations makes it a powerful tool for businesses and organizations looking to make data-driven decisions. Whether you’re in finance, healthcare, marketing, or any other industry, Power BI can help you unlock the potential of your data and drive business success.
Unraveling the Power BI Ecosystem
Power BI is a comprehensive business intelligence tool that consists of several components, each serving a unique purpose in the data analysis and visualization process. These components work together to provide a seamless experience for data analysis and visualization. The primary components of the Power BI ecosystem include Power BI Desktop, Power BI Service, Power BI Mobile, and Power BI Embedded.
Power BI Desktop is a free application that users can download to their local machines. It provides a robust set of features for data modeling, data transformation, and report creation. With Power BI Desktop, users can connect to various data sources, perform data analysis, and create interactive visualizations. Power BI Desktop also allows users to publish their reports to the Power BI Service for sharing and collaboration.
Power BI Service is a cloud-based platform that enables users to share, collaborate, and consume reports and dashboards. With Power BI Service, users can access their reports and dashboards from anywhere, on any device. Power BI Service also provides features for data governance, security, and access control, ensuring that sensitive data is protected and secure.
Power BI Mobile is a mobile application that enables users to access their reports and dashboards on their mobile devices. With Power BI Mobile, users can view and interact with their reports and dashboards, receive notifications, and collaborate with other users. Power BI Mobile also provides features for offline access, ensuring that users can access their data even when they are not connected to the internet.
Power BI Embedded is a service that enables developers to embed Power BI reports and dashboards into their applications. With Power BI Embedded, developers can provide their users with a seamless experience for data analysis and visualization, without requiring them to leave the application. Power BI Embedded also provides features for data governance, security, and access control, ensuring that sensitive data is protected and secure.
By understanding the components of the Power BI ecosystem, users can take full advantage of the tool’s capabilities for data analysis and visualization. Whether you’re working with Power BI Desktop, Power BI Service, Power BI Mobile, or Power BI Embedded, you can be confident that you’re using a robust and user-friendly business intelligence tool that can help you unlock the potential of your data and drive business success.
Key Features and Capabilities of Power BI
Power BI is a powerful business intelligence tool that offers a range of features and capabilities for data modeling, data transformation, and report creation. These features are essential in creating comprehensive and insightful data visualizations that help businesses and organizations make informed decisions.
Data Modeling
Data modeling is the process of creating a mathematical model of data. In Power BI, data modeling involves creating relationships between tables, defining measures, and creating hierarchies. By modeling data in Power BI, users can create a unified view of their data, making it easier to analyze and visualize.
Data Transformation
Data transformation is the process of cleaning, transforming, and shaping data to fit a user’s analysis needs. Power BI offers a range of data transformation tools, including the Power Query Editor, which enables users to transform and shape their data in a user-friendly interface. By transforming data in Power BI, users can ensure that their data is accurate, complete, and relevant to their analysis needs.
Report Creation
Report creation is the process of creating visualizations that help users analyze and understand their data. Power BI offers a range of report creation tools, including the Power BI Report Builder, which enables users to create interactive and visually appealing reports. By creating reports in Power BI, users can communicate their findings to stakeholders and decision-makers, helping them make informed decisions.
In summary, Power BI offers a range of key features and capabilities for data modeling, data transformation, and report creation. By using these features, users can create comprehensive and insightful data visualizations that help businesses and organizations make informed decisions. Understanding these features is essential for anyone looking to get started with Power BI and unlock the potential of their data.
How to Get Started with Power BI: A Step-by-Step Guide
Power BI is a powerful business intelligence tool that can help businesses and organizations make informed decisions by providing comprehensive and insightful data visualizations. To get started with Power BI, follow these simple steps:
Create a Power BI Account
To use Power BI, you need to create a Power BI account. Visit the Power BI website and click on the “Sign up” button. Follow the prompts to create your account, including providing your email address, creating a password, and entering your contact information.
Real-World Applications of Power BI
Power BI is a versatile business intelligence tool that can be used in a variety of industries and applications. Here are some examples of how businesses and organizations use Power BI for data analysis and visualization:
Finance
Financial institutions use Power BI to analyze financial data, such as revenue, expenses, and profitability. With Power BI, financial analysts can create interactive dashboards that provide real-time insights into financial performance. Power BI can also be used to identify trends and patterns in financial data, helping financial institutions make informed decisions about investments and financial strategies.
Healthcare
Healthcare organizations use Power BI to analyze patient data, such as medical histories, lab results, and treatment plans. With Power BI, healthcare professionals can create visualizations that help them identify patterns and trends in patient data, such as the prevalence of certain diseases or the effectiveness of certain treatments. Power BI can also be used to monitor patient outcomes and identify areas for improvement in healthcare delivery.
Marketing
Marketing professionals use Power BI to analyze customer data, such as demographics, buying habits, and preferences. With Power BI, marketers can create visualizations that help them understand their customers and target their marketing efforts more effectively. Power BI can also be used to track the performance of marketing campaigns and identify areas for improvement.
These are just a few examples of how Power BI is used in the real world. By providing comprehensive and insightful data visualizations, Power BI can help businesses and organizations in any industry make informed decisions and achieve their goals.
Comparing Power BI with Other Business Intelligence Tools
Power BI is a powerful business intelligence tool, but it’s not the only one on the market. Here’s a comparison of Power BI with other popular business intelligence tools, such as Tableau and QlikView, to help you decide which tool is right for you.
Tableau
Tableau is a data visualization tool that is known for its ease of use and powerful visualization capabilities. Like Power BI, Tableau can connect to a variety of data sources and perform data analysis and visualization. However, Tableau has a steeper learning curve than Power BI and can be more expensive, especially for larger organizations.
One advantage of Tableau is its ability to create complex visualizations that are not possible with Power BI. Tableau also has a larger community of users, which means there are more resources available for learning and troubleshooting. However, Power BI has a more user-friendly interface and is better suited for users who are new to business intelligence.
QlikView
QlikView is a business intelligence tool that is known for its associative data model, which allows users to explore data in a more flexible and intuitive way. Like Power BI and Tableau, QlikView can connect to a variety of data sources and perform data analysis and visualization. However, QlikView has a steeper learning curve than Power BI and can be more expensive, especially for larger organizations.
One advantage of QlikView is its associative data model, which allows users to explore data in a more flexible and intuitive way. QlikView also has a more robust data modeling capability than Power BI and Tableau. However, Power BI has a more user-friendly interface and is better suited for users who are new to business intelligence.
In conclusion, Power BI, Tableau, and QlikView are all powerful business intelligence tools that can help businesses and organizations make informed decisions. The choice of which tool to use depends on the specific needs and requirements of the organization. Power BI is a great choice for users who are new to business intelligence and are looking for a user-friendly and affordable tool. Tableau and QlikView are better suited for users who require more complex visualizations and data modeling capabilities.
Best Practices for Using Power BI
Power BI is a powerful business intelligence tool, but to get the most out of it, it’s important to follow best practices for using the tool. Here are some best practices for using Power BI to ensure a smooth and efficient experience for data analysis and visualization.
Data Governance
Data governance is the process of managing the availability, usability, integrity, and security of data. In Power BI, data governance is essential to ensure that data is accurate, secure, and accessible to the right people. To practice good data governance in Power BI, it’s important to establish clear policies and procedures for data management, including data access, data security, and data quality.
Security
Security is an important consideration in Power BI, as the tool often deals with sensitive data. To ensure the security of data in Power BI, it’s important to use role-based security to control access to data, encrypt data in transit and at rest, and use secure connections to data sources. It’s also important to regularly review and update security policies and procedures to ensure they are up-to-date and effective.
Collaboration
Collaboration is a key benefit of Power BI, as it allows multiple users to work together on data analysis and visualization projects. To ensure effective collaboration in Power BI, it’s important to establish clear communication channels, define roles and responsibilities, and use version control to manage changes to reports and dashboards. It’s also important to use Power BI’s collaboration features, such as sharing reports and dashboards, to facilitate collaboration and communication.
Data Modeling
Data modeling is the process of creating a model of data to support data analysis and visualization. In Power BI, data modeling is essential to ensure that data is structured correctly and can be easily analyzed. To practice good data modeling in Power BI, it’s important to create a logical and consistent data model, use data relationships to connect tables, and use data transformations to clean and transform data.
Report Creation
Report creation is the process of creating visualizations of data in Power BI. To create effective reports in Power BI, it’s important to use best practices for visualization, such as using the right chart type for the data, using appropriate colors and labels, and using interactive features to facilitate exploration of data. It’s also important to use Power BI’s report creation features, such as custom visuals and report themes, to create visually appealing and informative reports.
In conclusion, following best practices for using Power BI, such as data governance, security, collaboration, data modeling, and report creation, can help ensure a smooth and efficient experience for data analysis and visualization. By following these best practices, businesses and organizations can get the most out of Power BI and make informed decisions based on comprehensive and insightful data visualizations.
The Future of Power BI: Trends and Developments
Power BI is a powerful business intelligence tool that has transformed the way businesses and organizations analyze and visualize data. As the field of business intelligence continues to evolve, Power BI is adapting to meet the changing needs of businesses and organizations. Here are some trends and developments to watch for in the future of Power BI.
Artificial Intelligence and Machine Learning
Artificial intelligence (AI) and machine learning (ML) are two of the most exciting developments in the field of business intelligence. Power BI is embracing these technologies, with new features that use AI and ML to automate data analysis and provide more accurate predictions. For example, Power BI’s “Quick Insights” feature uses ML to automatically identify trends and patterns in data, while the “Decomposition Tree” feature uses AI to help users understand the drivers of a particular metric.
Real-Time Data Analysis
Real-time data analysis is becoming increasingly important for businesses and organizations that need to make quick decisions based on up-to-the-minute data. Power BI is meeting this need with new features that enable real-time data analysis, such as Power BI Real-Time Streaming and Power BI Push Datasets. These features allow users to stream data in real-time from various sources, such as sensors, social media, and websites, and analyze the data using Power BI’s powerful visualization tools.
Integration with Other Microsoft Products
Microsoft is integrating Power BI with other Microsoft products, such as Microsoft Teams and Dynamics 365, to provide a more seamless experience for users. For example, Power BI integration with Microsoft Teams allows users to share Power BI reports and dashboards directly in Teams, while Power BI integration with Dynamics 365 enables users to analyze data from Dynamics 365 directly in Power BI.
Enhanced Data Security and Privacy
Data security and privacy are critical considerations for businesses and organizations that use Power BI. Power BI is addressing these concerns with new features that enhance data security and privacy, such as data lineage tracking, dynamic data masking, and bring-your-own-key (BYOK) encryption. These features help ensure that data is secure and private, and that users have control over who can access and use their data.
Conclusion
Power BI is a powerful business intelligence tool that is evolving to meet the changing needs of businesses and organizations. With new features that leverage AI and ML, enable real-time data analysis, integrate with other Microsoft products, and enhance data security and privacy, Power BI is well-positioned to continue to be a leader in the field of business intelligence. By staying up-to-date with the latest trends and developments in Power BI, businesses and organizations can ensure they are getting the most out of this powerful tool and making informed decisions based on comprehensive and insightful data visualizations.


