
Microsoft Power BI: A Powerful Business Intelligence Tool
Microsoft Power BI is a leading business intelligence tool that empowers organizations to transform raw data into actionable insights. By leveraging Power BI features, users can effectively analyze and visualize data, enabling them to make informed decisions and drive business growth. Understanding these features is crucial for maximizing the potential of Power BI in business analytics.
Data Preparation and Modeling: The Foundation of Power BI
Data preparation and modeling are essential components of Microsoft Power BI features, providing users with the ability to clean, transform, and model data for analysis. These functionalities enable organizations to derive meaningful insights from their data, leading to informed decision-making and strategic planning.
Data profiling is one of the critical features in Power BI, allowing users to assess the quality and structure of their data. By identifying data inconsistencies, missing values, or outliers, users can ensure their data is accurate and reliable before proceeding with analysis. Power BI’s data transformation capabilities enable users to clean and transform data using a wide range of functions and operators, making it easier to prepare data for modeling and visualization.
Relationship management is another key aspect of Power BI’s data preparation and modeling features. Users can create and manage relationships between tables, ensuring data consistency and enabling more sophisticated analysis. Power BI supports various relationship types, including one-to-many, many-to-one, and many-to-many relationships, providing users with the flexibility to model their data according to their specific needs.
Data Visualization: Bringing Data to Life
Data visualization is a critical aspect of Microsoft Power BI features, enabling users to present data in a visually appealing and easily digestible format. By employing effective visualizations, users can convey complex data stories, making it simple for stakeholders to understand and act upon the insights derived from their data.
Power BI offers a wide range of built-in visualizations, including charts, graphs, and maps, allowing users to represent data in various ways. These visualizations cater to different data types and use cases, ensuring that users can find the most suitable option for their specific needs. Additionally, Power BI supports custom visualizations, enabling users to create and integrate unique visual representations of their data using third-party tools or community-developed options.
To create effective visualizations in Power BI, users should follow best practices such as using the right chart type for the data, minimizing visual clutter, and ensuring proper labeling and formatting. By adhering to these guidelines, users can ensure their visualizations are clear, accurate, and engaging, ultimately enhancing the data analysis process.
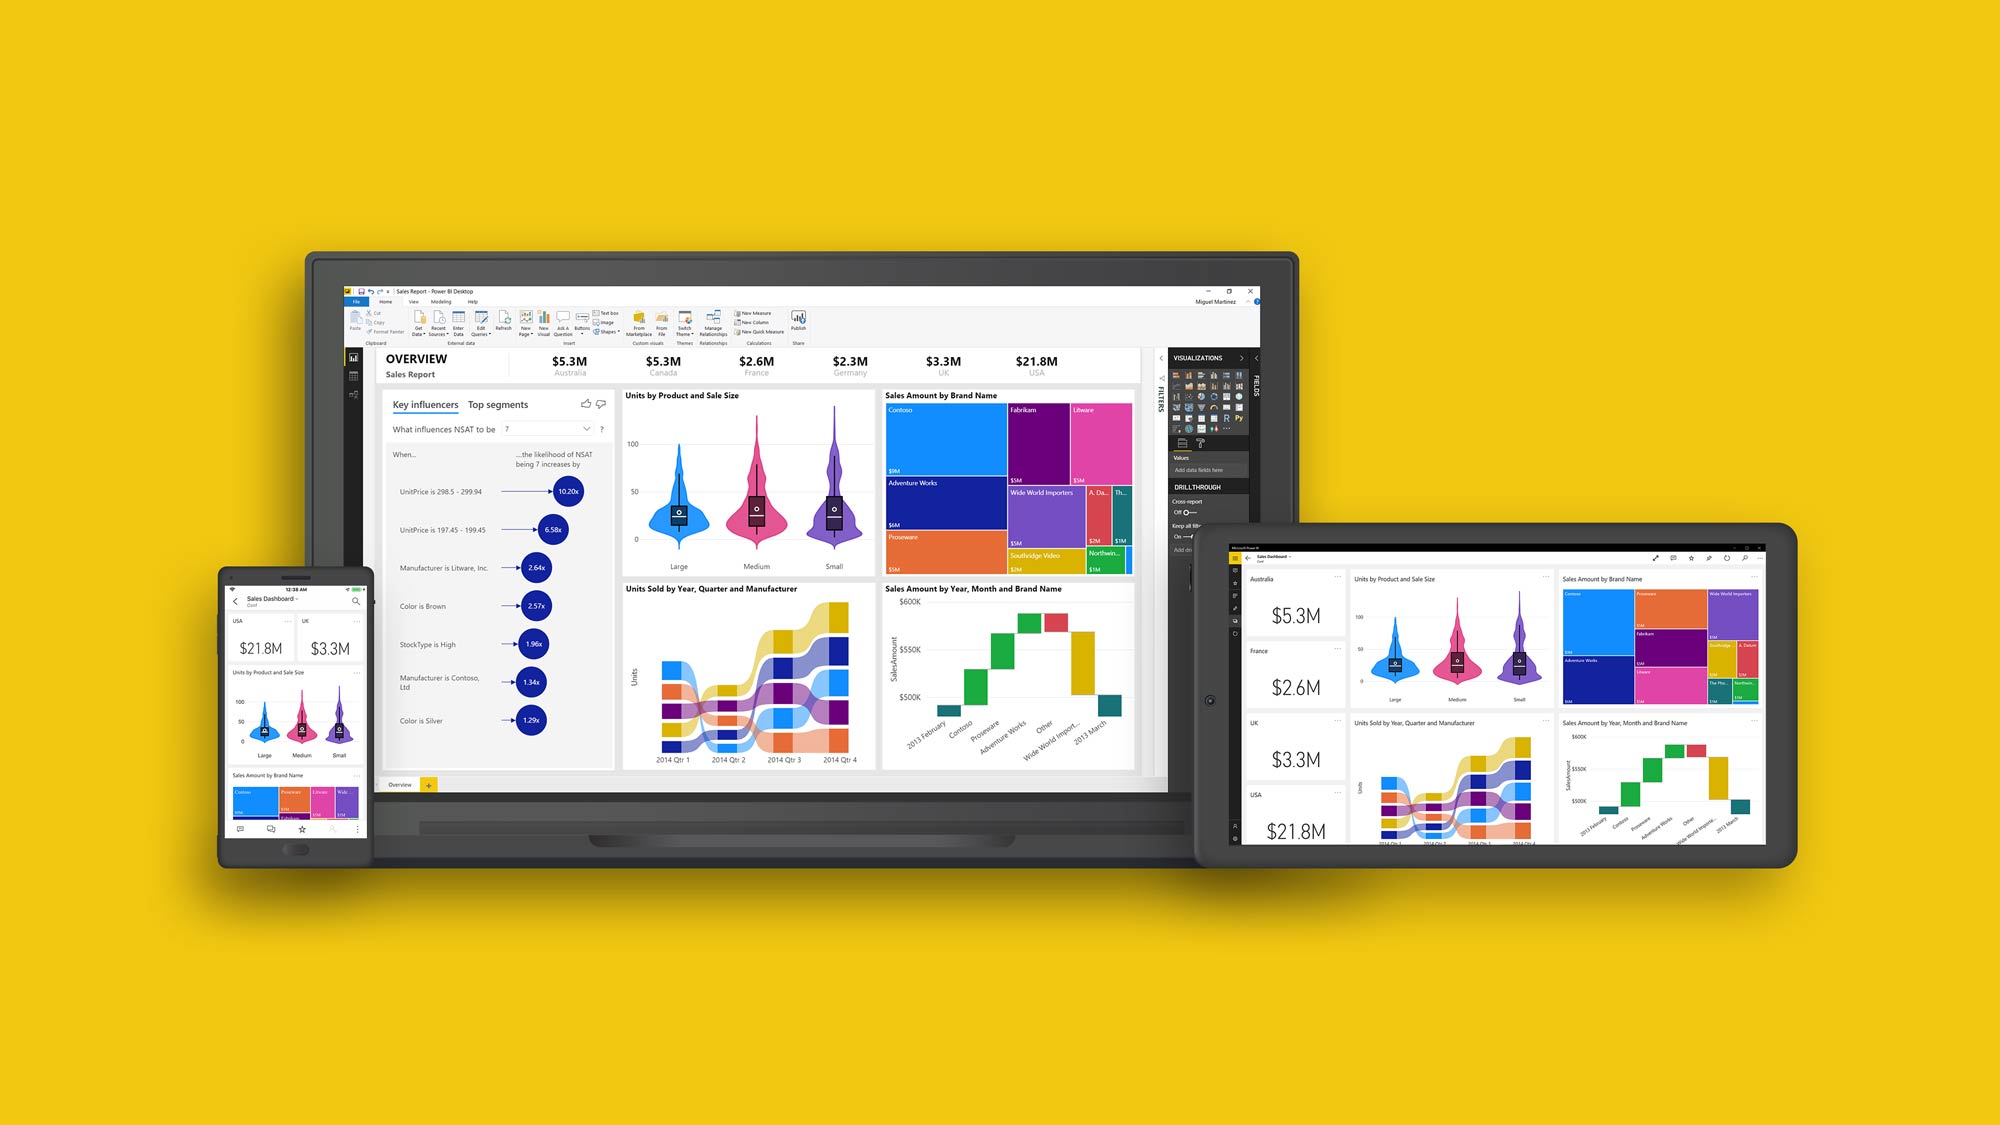
How to Create Interactive Reports in Microsoft Power BI
Interactive reports are an essential aspect of Microsoft Power BI features, allowing users to create engaging, interactive visualizations that facilitate data exploration and analysis. By following a structured process, users can develop effective reports that cater to various devices and audiences.
To create an interactive report in Power BI, begin by selecting a suitable report layout. Power BI offers pre-defined layouts, or users can create custom layouts tailored to their specific needs. Next, determine the visual placement, ensuring that each visual serves a purpose and contributes to the overall data story. Format the report appropriately, using visual best practices such as proper labeling, consistent color schemes, and appropriate chart types.
When designing interactive reports, consider the target audience and optimize the report for various devices. Power BI supports mobile optimization, enabling users to consume and interact with reports on smartphones and tablets. Additionally, incorporate interactive elements such as filters, slicers, and drill-through actions to enhance user engagement and facilitate deeper data exploration.
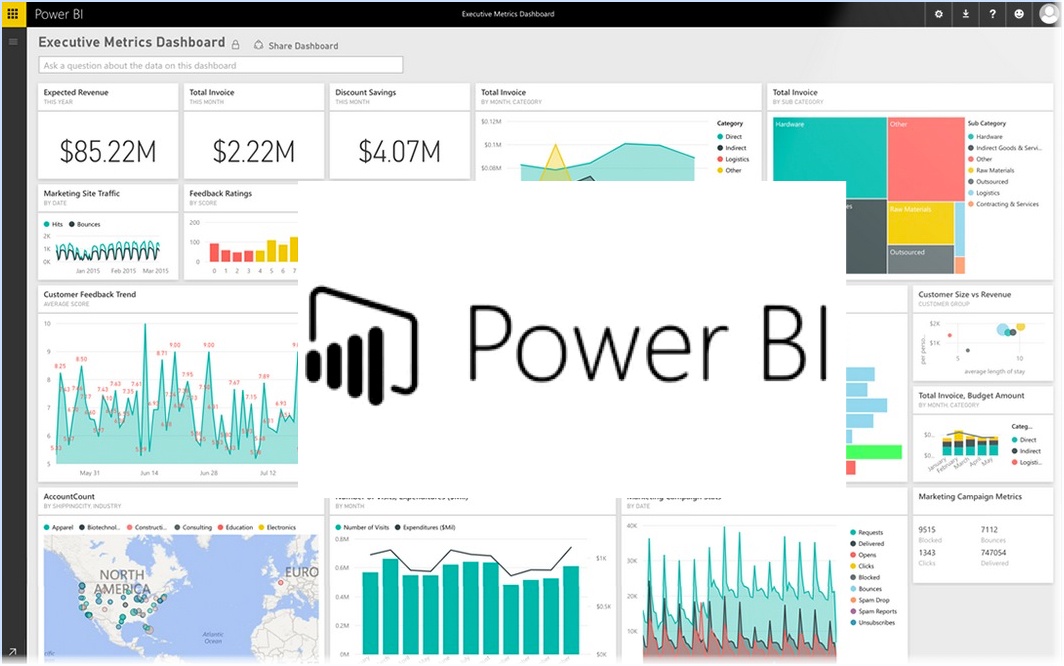
Power BI Dashboards: Monitoring Key Performance Indicators
Power BI dashboards are an integral part of Microsoft Power BI features, offering users the ability to monitor and analyze key performance indicators (KPIs) in real-time. By creating, sharing, and collaborating on dashboards, users can effectively track and communicate data-driven insights across the organization.
To create a Power BI dashboard, users first gather relevant data from various sources, such as Excel, databases, or cloud services. After connecting the data to Power BI, users can create tiles, which represent individual visualizations or KPIs. Users can then arrange these tiles on a dashboard, creating a cohesive and engaging display of data.
Sharing and collaborating on dashboards is a crucial aspect of Power BI’s functionality. Users can share dashboards with specific individuals or groups, enabling real-time data access and collaboration. Additionally, Power BI allows for the integration of dashboards with other applications, such as Microsoft Teams or SharePoint, further streamlining the data analysis and decision-making process.
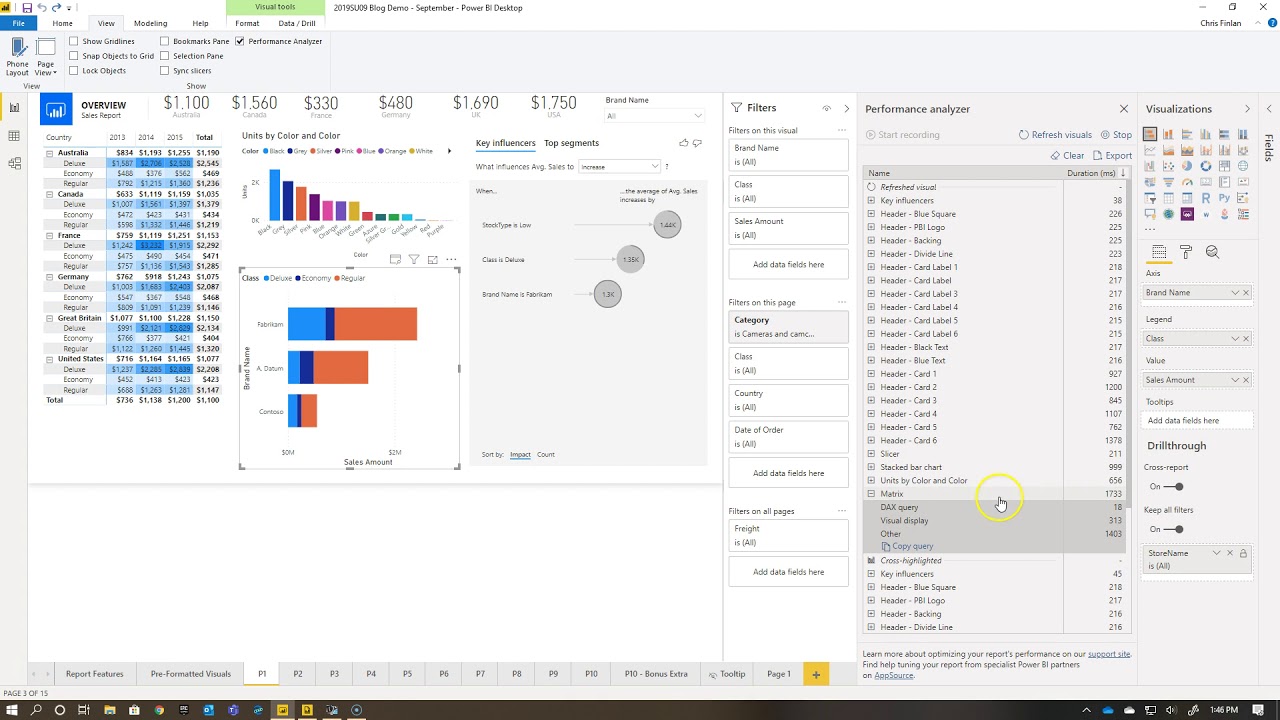
Advanced Analytics: Unlocking Hidden Insights with Microsoft Power BI Features
Microsoft Power BI offers advanced analytics capabilities that enable users to uncover hidden patterns, trends, and correlations within their data. By leveraging AI-driven insights, predictive analytics, and natural language processing, users can make more informed decisions and drive better business outcomes.
AI-driven insights in Power BI use machine learning algorithms to automatically analyze data and identify trends, outliers, and patterns. These insights can help users quickly identify areas of interest and opportunity, enabling them to focus their analysis on the most critical aspects of their data.
Predictive analytics is another powerful feature of Power BI, allowing users to create statistical models that forecast future trends based on historical data. By using these models, users can anticipate future outcomes, identify potential risks, and optimize their decision-making processes.
Natural language processing (NLP) in Power BI enables users to interact with their data using everyday language. By asking questions in plain English, users can quickly and easily retrieve insights and answers, making data analysis more accessible and intuitive for a broader range of users.
Power BI Collaboration and Distribution: Sharing Insights Across the Organization
Microsoft Power BI offers robust collaboration and distribution features, enabling users to securely share insights and reports with stakeholders across the organization. By utilizing app workspaces, content packs, and the Power BI service, users can effectively distribute data-driven insights, fostering a data-driven culture and informed decision-making.
App workspaces in Power BI provide a secure and collaborative environment for teams to work on content development, such as reports and dashboards. By inviting team members to an app workspace, users can collaborate on content creation, ensuring that insights are accurate, relevant, and up-to-date. Once content is finalized, users can publish it to the Power BI service for broader distribution.
Content packs allow users to package and distribute reports, dashboards, and datasets to other Power BI users. By sharing content packs, users can ensure that stakeholders have access to the most recent data and insights, streamlining the decision-making process and promoting data consistency across the organization.
The Power BI service facilitates the distribution of content by enabling users to share reports, dashboards, and datasets with specific individuals or groups. Users can also embed Power BI content in other applications, such as SharePoint or Microsoft Teams, further enhancing collaboration and data accessibility.

Power BI Governance and Administration: Ensuring Data Security and Compliance
Microsoft Power BI offers robust governance and administration features to help organizations maintain data security and compliance. By leveraging tenant settings, data loss prevention, and auditing capabilities, users can ensure that sensitive data remains protected and that their Power BI environment adheres to industry regulations and best practices.
Tenant settings in Power BI enable administrators to establish and enforce organization-wide policies, such as limiting data connectors, controlling external sharing, and managing workspace creation. By configuring these settings, organizations can maintain a secure Power BI environment that aligns with their unique data security and compliance requirements.
Data loss prevention (DLP) in Power BI helps organizations protect sensitive data by identifying, monitoring, and securing sensitive information. By using DLP policies, users can prevent the inadvertent sharing or exposure of sensitive data, ensuring that their Power BI environment remains secure and compliant with data protection regulations.
Auditing in Power BI provides administrators with detailed logs and reports on user activity, enabling them to track and monitor usage patterns, identify potential security threats, and maintain a secure and compliant Power BI environment. By regularly reviewing audit logs and reports, organizations can proactively address any data security or compliance concerns, ensuring that their Power BI implementation remains secure and effective.
