
The Power of Data Visualization with Microsoft Dashboards
In today’s data-driven world, businesses rely on data to make informed decisions and drive growth. Data visualization, the representation of data in a graphical format, plays a crucial role in making complex information more accessible and actionable. Microsoft, a leading technology company, offers a variety of dashboard solutions to help users better understand and interpret their data through powerful and visually appealing data visualization tools, known as Microsoft dashboards.

Microsoft Power BI: A Comprehensive Data Visualization Solution
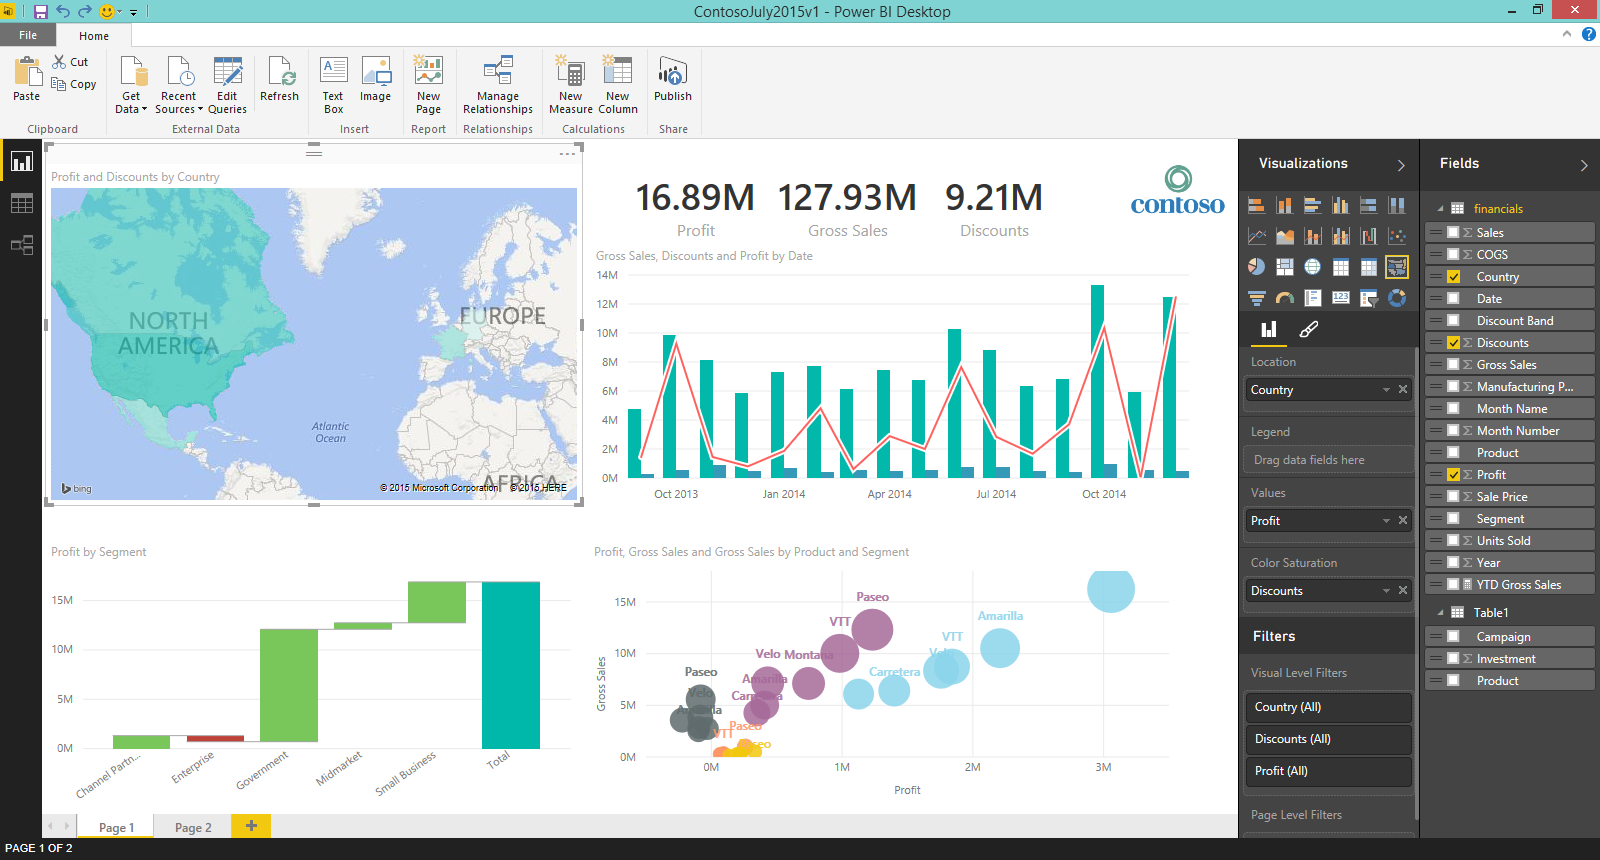
Microsoft Power BI is a robust and flexible data visualization solution that offers a wide range of features and capabilities. Designed to cater to the needs of modern businesses, Power BI simplifies the process of creating, customizing, and sharing interactive visualizations, enabling users to make informed decisions based on data-driven insights. With its ease of use, seamless integration with other Microsoft products, and support for various data sources, Power BI has become a popular choice for businesses looking to harness the power of data.
Popular Microsoft Power BI Dashboards: Unlocking Valuable Insights
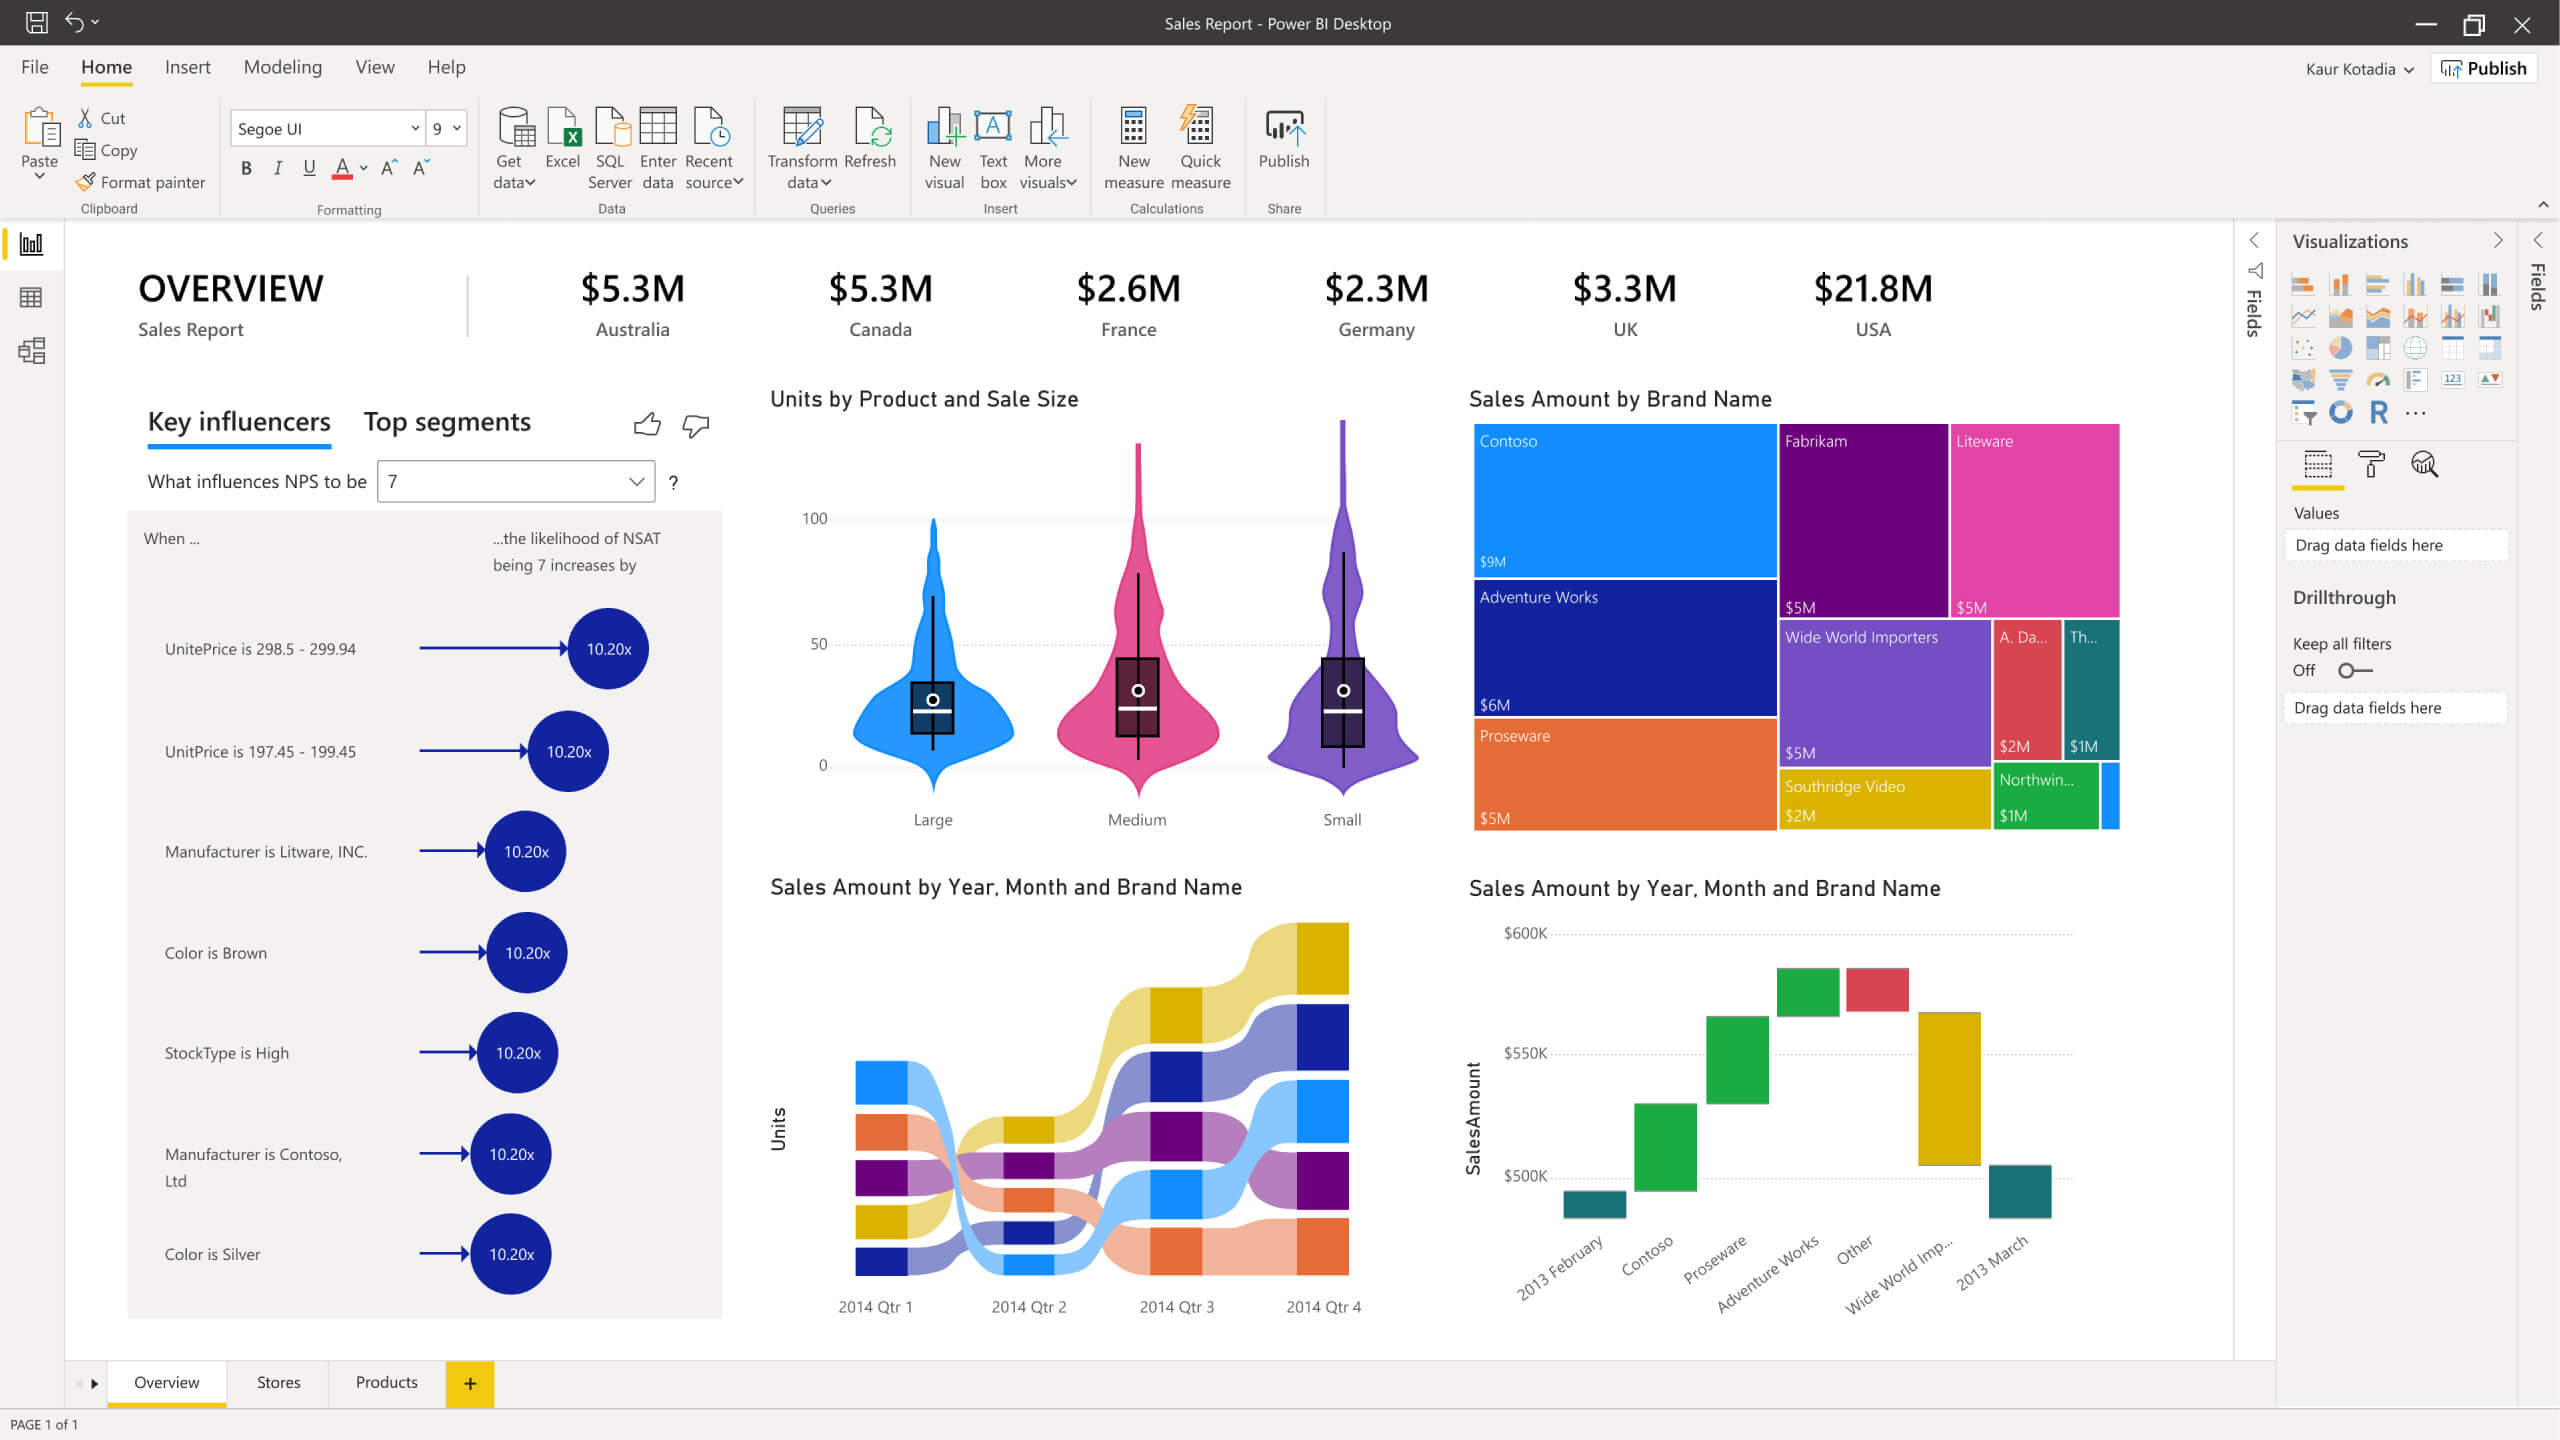
Microsoft Power BI offers a wide range of pre-built dashboards that cater to various business needs and use cases. These dashboards simplify the process of data analysis and visualization, enabling users to unlock valuable insights and make informed decisions. In this section, we will explore some of the most popular Microsoft Power BI dashboards, including Sales Analysis, Customer Insights, and Financial Reporting.

How to Create a Custom Microsoft Power BI Dashboard: A Step-by-Step Guide
Microsoft Power BI offers users the flexibility to create custom dashboards that cater to their unique needs and preferences. By following these step-by-step instructions, you can create engaging and informative visualizations that provide valuable insights and drive business success.
Step 1: Define Your Data Sources
The first step in creating a custom Microsoft Power BI dashboard is to define your data sources. Power BI supports various data sources, including Excel, SQL Server, and cloud-based services. Identify the data sources that are relevant to your dashboard and ensure that they are properly configured and accessible.
Step 2: Import and Clean Your Data
Once you have defined your data sources, import the data into Power BI. Use Power BI’s data cleaning and transformation tools to ensure that your data is accurate, complete, and consistent. Remove any irrelevant or redundant data, and ensure that your data is properly formatted and structured for visualization.
Step 3: Create Your Visualizations
With your data imported and cleaned, you can now create your visualizations. Use Power BI’s drag-and-drop interface to add visualizations, such as charts, graphs, and maps, to your dashboard. Customize the visualizations to suit your needs, and ensure that they are clear, concise, and easy to understand.
Step 4: Organize Your Dashboard
Once you have created your visualizations, organize your dashboard to ensure that it is logical, intuitive, and easy to navigate. Use Power BI’s layout tools to arrange your visualizations in a clear and concise manner, and ensure that they are properly labeled and annotated.
Step 5: Share and Collaborate
With your custom Microsoft Power BI dashboard complete, share it with your team members and stakeholders for collaboration and discussion. Use Power BI’s sharing and collaboration features to ensure that everyone is on the same page and moving in the same direction.
In conclusion, creating a custom Microsoft Power BI dashboard is a straightforward process that can provide valuable insights and drive business success. By following these step-by-step instructions, you can create engaging and informative visualizations that cater to your unique needs and preferences. With its flexibility, ease of use, and integration with other Microsoft products, Power BI is an ideal solution for businesses looking to harness the power of data visualization.
Microsoft Dynamics 365: Unlocking the Power of Industry-Specific Dashboards
Microsoft Dynamics 365 offers a range of industry-specific dashboards that cater to the unique needs and requirements of businesses in various sectors. By leveraging the power of these dashboards, businesses can unlock valuable insights, optimize their operations, and drive success in today’s competitive marketplace.
Retail
Microsoft Dynamics 365 for Retail provides a range of dashboards that enable retailers to better understand and analyze their sales, inventory, and customer data. With real-time insights into sales performance, inventory levels, and customer behavior, retailers can make informed decisions and optimize their operations for success.
Manufacturing
Microsoft Dynamics 3
Microsoft Azure: Unleashing the Power of Real-Time Analytics and IoT Dashboards
Microsoft Azure offers a range of real-time analytics and IoT dashboards that enable businesses to monitor and analyze data from various sources, including sensors and devices. By leveraging the power of these dashboards, businesses can unlock valuable insights, optimize their operations, and drive success in today’s data-driven marketplace.
Real-Time Analytics
Microsoft Azure’s real-time analytics dashboards provide businesses with the ability to monitor and analyze data in real-time. With these dashboards, businesses can track key performance indicators (KPIs), monitor trends, and identify areas for improvement in real-time. This enables businesses to make informed decisions and take immediate action to optimize their operations and drive success.
IoT Dashboards
Microsoft Azure’s IoT dashboards enable businesses to monitor and analyze data from sensors and devices in real-time. With these dashboards, businesses can track the performance of their IoT devices, monitor sensor data, and identify areas for improvement. This enables businesses to optimize their IoT deployments, reduce downtime, and improve overall performance.
Benefits of Microsoft Azure Dashboards
Microsoft Azure’s real-time analytics and IoT dashboards offer a range of benefits for businesses, including:
- Improved decision-making: With real-time insights into key performance indicators, businesses can make informed decisions and take immediate action to optimize their operations.
- Increased efficiency: By monitoring trends and identifying areas for improvement in real-time, businesses can increase efficiency and reduce downtime.
- Enhanced security: Microsoft Azure’s real-time analytics and IoT dashboards provide businesses with the ability to monitor and analyze data in a secure and controlled environment.
- Scalability: Microsoft Azure’s real-time analytics and IoT dashboards are highly scalable, enabling businesses to handle large volumes of data and support growing demands.
Conclusion
Microsoft Azure’s real-time analytics and IoT dashboards provide businesses with the ability to monitor and analyze data from various sources in real-time. By leveraging the power of these dashboards, businesses can unlock valuable insights, optimize their operations, and drive success in today’s data-driven marketplace. Whether you’re looking to improve decision-making, increase efficiency, enhance security, or support growing demands, Microsoft Azure’s real-time analytics and IoT dashboards have you covered.

Comparing Microsoft Dashboard Solutions to Competitors: Tableau and Google Data Studio
When it comes to data visualization tools, Microsoft offers a range of powerful and flexible dashboard solutions. However, it’s important to compare Microsoft’s offerings to those of its competitors, such as Tableau and Google Data Studio, to determine which platform is the best fit for your business needs.
Microsoft vs. Tableau
Tableau is a popular data visualization tool that offers a range of features and capabilities similar to those of Microsoft Power BI. Both platforms offer real-time data analysis, customizable dashboards, and integration with a variety of data sources. However, there are some key differences between the two platforms.
- Pricing: Tableau offers a range of pricing options, including a free version, while Microsoft Power BI offers a free trial and a paid version with additional features.
- Ease of use: Both platforms are user-friendly, but some users find Tableau to be more intuitive and easier to use, especially for those without a background in data analysis.
- Integration: Microsoft Power BI integrates seamlessly with other Microsoft products, such as Excel and SharePoint, while Tableau offers integration with a wider range of third-party tools.
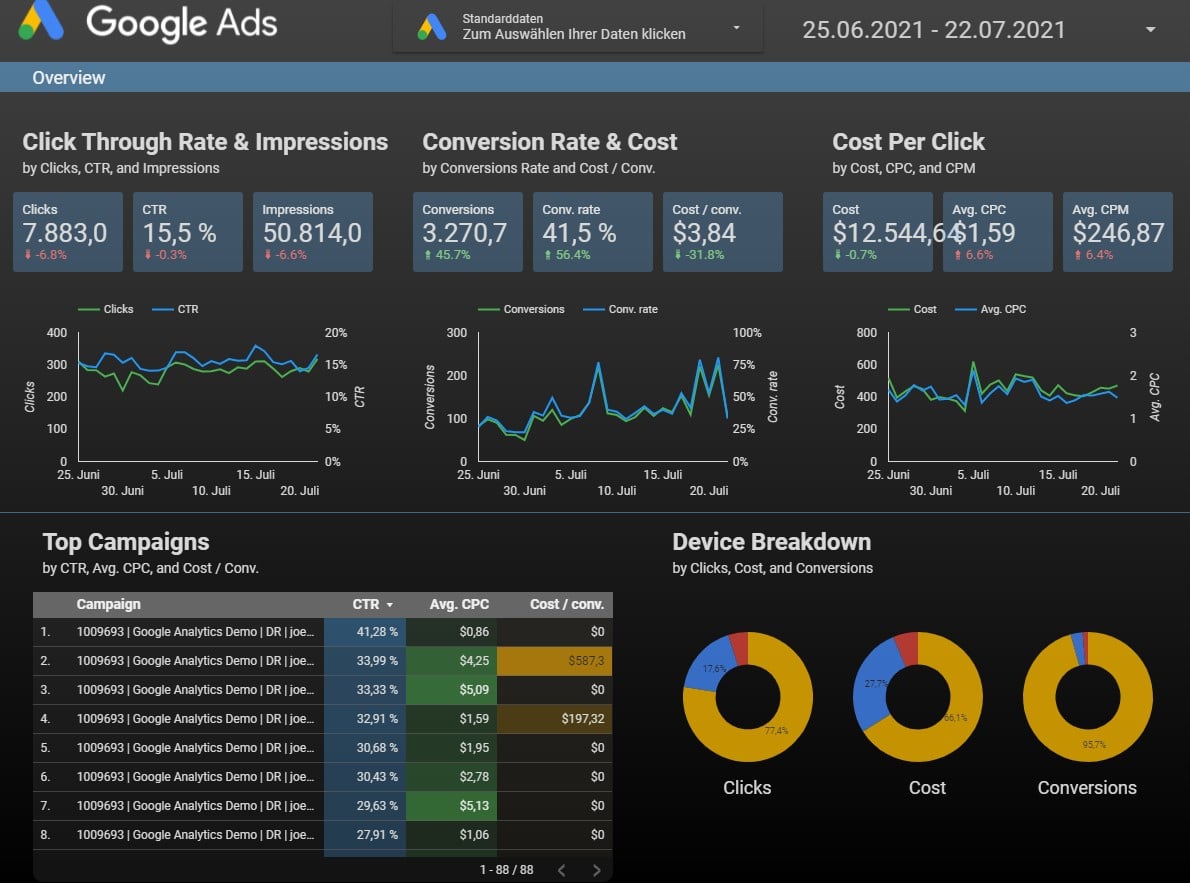
Microsoft vs. Google Data Studio
Google Data Studio is a free data visualization tool that offers a range of features and capabilities similar to those of Microsoft Power BI. Both platforms offer customizable dashboards, real-time data analysis, and integration with a variety of data sources.
- Pricing: Google Data Studio is free, while Microsoft Power BI offers a free trial and a paid version with additional features.
- Ease of use: Both platforms are user-friendly, but some users find Google Data Studio to be more limited in terms of customization options and visualizations compared to Microsoft Power BI.
- Integration: Google Data Studio integrates seamlessly with other Google products, such as Google Analytics and Google Sheets, while Microsoft Power BI offers integration with a wider range of third-party tools.
Choosing the Right Platform
When it comes to choosing the right data visualization tool for your business, it’s important to consider a range of factors, including pricing, ease of use, and integration with other tools. Both Microsoft Power BI and its competitors, such as Tableau and Google Data Studio, offer powerful and flexible dashboard solutions that can help businesses unlock valuable insights and optimize their operations.
To get the most out of your data visualization tools, it’s important to take advantage of collaboration, automation, and customization features. By working with your team to design effective and engaging visualizations, automating data updates, and customizing dashboards to meet your specific needs, you can maximize the value of your data and drive success in today’s data-driven marketplace.
Optimizing Your Microsoft Dashboard Experience: Collaboration, Automation, and Customization
Microsoft dashboards offer a range of features and capabilities to help businesses unlock valuable insights and optimize their operations. To get the most out of your Microsoft dashboard experience, it’s important to take advantage of collaboration, automation, and customization features.
Collaboration
Collaboration is key to getting the most out of your Microsoft dashboards. By working with your team to design effective and engaging visualizations, you can ensure that everyone is on the same page and working towards the same goals. Microsoft Power BI offers a range of collaboration features, including real-time data sharing, team collaboration spaces, and the ability to publish dashboards to the web or mobile devices.
Automation
Automation can help you save time and reduce manual effort when it comes to data visualization. Microsoft Power BI offers a range of automation features, including data refresh schedules, alerts, and the ability to automate report generation and distribution. By automating these tasks, you can free up more time to focus on analyzing and acting on your data.
Customization
Customization is key to creating effective and engaging visualizations that meet the specific needs of your business. Microsoft Power BI offers a range of customization features, including the ability to create custom visualizations, add filters and slicers, and customize the layout and formatting of your dashboards. By customizing your dashboards to meet your specific needs, you can ensure that you’re getting the most value out of your data.
Best Practices for Optimizing Your Microsoft Dashboard Experience
- Collaborate with your team to design effective and engaging visualizations.
- Automate data refresh schedules, alerts, and report generation to save time and reduce manual effort.
- Customize your dashboards to meet the specific needs of your business.
- Take advantage of training and support resources to help you get the most out of your Microsoft dashboard experience.
Conclusion
Microsoft dashboards offer a range of features and capabilities to help businesses unlock valuable insights and optimize their operations. By taking advantage of collaboration, automation, and customization features, you can get the most out of your Microsoft dashboard experience and drive success in today’s data-driven marketplace.
