Understanding Kubernetes Pod Monitoring
Kubernetes pod monitoring is an essential practice for maintaining system health and ensuring optimal performance. It involves observing and tracking the status, metrics, and logs of Kubernetes pods in real-time. Monitoring plays a critical role in identifying issues, troubleshooting problems, and making data-driven decisions for system optimization.
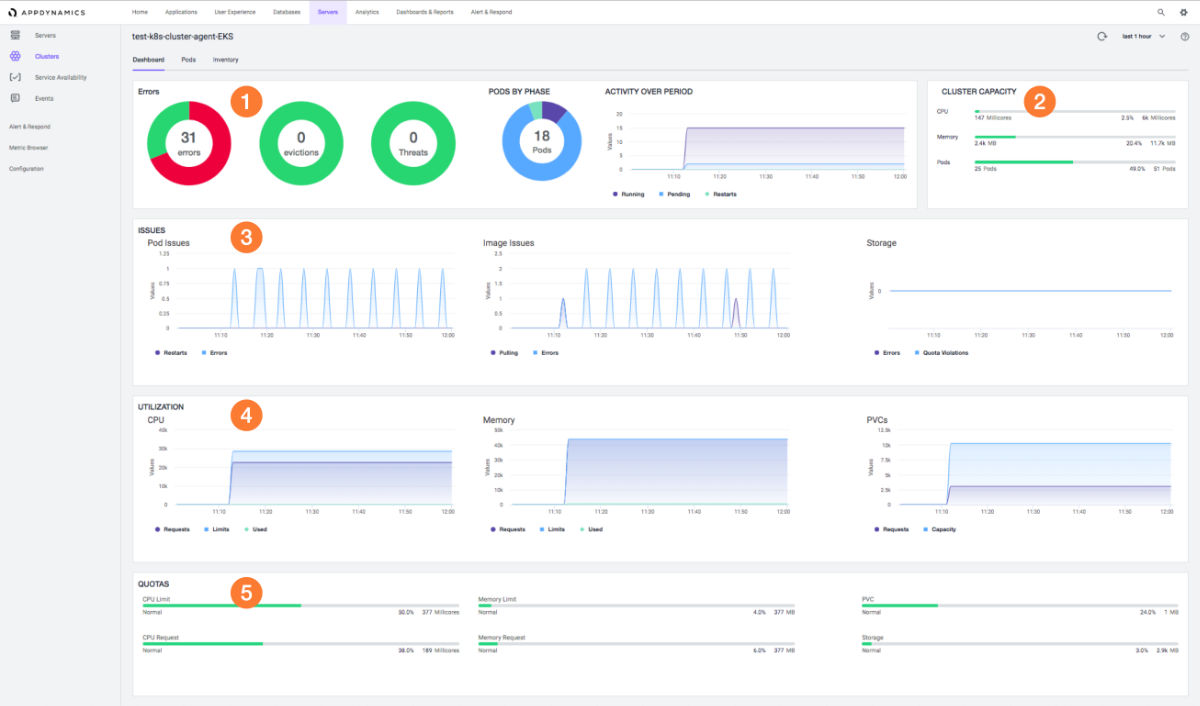
Kubernetes pod monitoring encompasses various aspects, including resource utilization, network communication, and application performance. By monitoring these factors, organizations can proactively detect and address potential issues before they impact the system’s overall health and availability. Real-time monitoring, alerting, and logging are crucial components of Kubernetes pod monitoring, providing valuable insights and facilitating effective management of Kubernetes environments.
Monitoring Kubernetes pods poses unique challenges due to the dynamic nature of containerized applications and the ephemeral lifecycle of pods. As a result, selecting the right tools and implementing best practices are vital for successful Kubernetes pod monitoring. In the following sections, we will discuss popular Kubernetes pod monitoring tools, their features, and how to set up monitoring using Prometheus.
Top Kubernetes Pod Monitoring Tools
When it comes to Kubernetes pod monitoring, several tools are available to help manage and maintain system health. Among the most popular are Prometheus, Grafana, and the Kubernetes Dashboard. Each tool offers unique features, strengths, and weaknesses, making them suitable for different use cases and requirements.
Prometheus
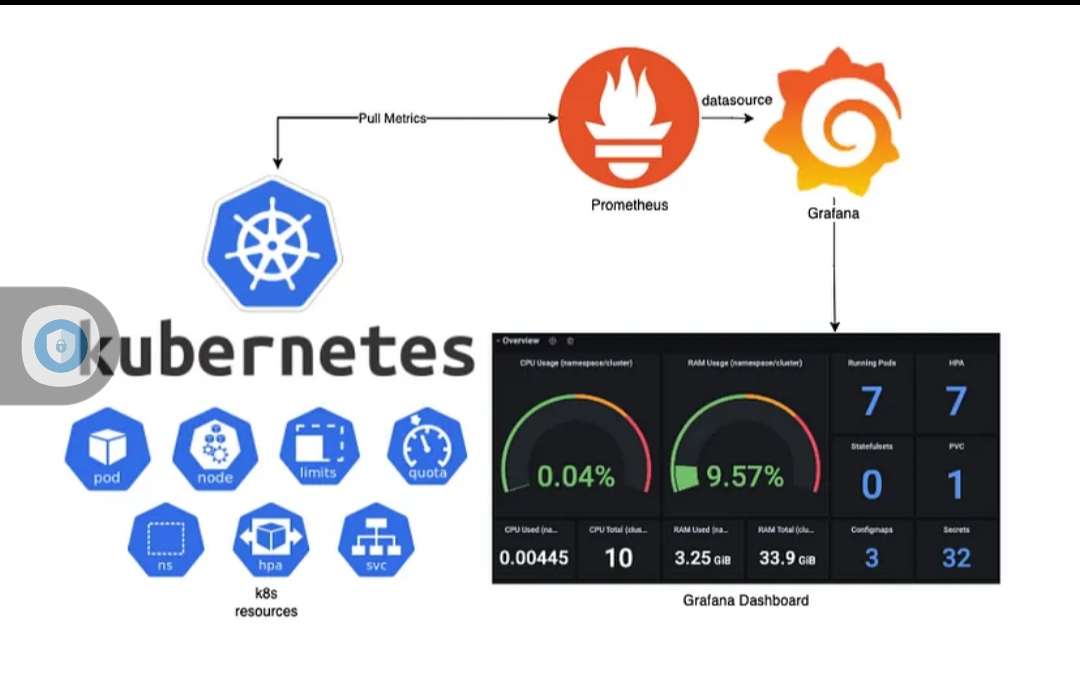
Prometheus is an open-source monitoring and alerting system designed for reliability and scalability. It excels at collecting time-series data, which can be visualized and analyzed using Grafana. Prometheus integrates well with Kubernetes, enabling easy monitoring of pods, services, and nodes. Its query language, PromQL, allows for flexible data manipulation and analysis, making it a powerful tool for Kubernetes pod monitoring.
Grafana
Grafana is a popular open-source platform for data visualization and monitoring. It integrates with various data sources, including Prometheus, allowing users to create custom dashboards and visualizations. Grafana’s flexibility, customizability, and support for alerting make it an ideal companion for Prometheus in Kubernetes pod monitoring setups.
Kubernetes Dashboard
The Kubernetes Dashboard is a web-based UI for managing and monitoring Kubernetes clusters. It offers an easy-to-use interface for deploying applications, managing resources, and monitoring cluster health. While not as feature-rich as Prometheus and Grafana, the Kubernetes Dashboard provides a user-friendly option for basic Kubernetes pod monitoring and management.
In real-life scenarios, organizations often combine these tools to create comprehensive Kubernetes pod monitoring solutions. For instance, Prometheus can be used to collect and analyze metrics, while Grafana visualizes the data and sends alerts based on predefined conditions. The Kubernetes Dashboard, on the other hand, can serve as a user-friendly interface for managing and monitoring Kubernetes resources.
Setting Up Kubernetes Pod Monitoring with Prometheus
Prometheus is a powerful open-source monitoring and alerting system, ideal for Kubernetes pod monitoring. To set up Prometheus for Kubernetes pod monitoring, follow these steps:
Step 1: Deploy Prometheus to Your Kubernetes Cluster
Use a Helm chart, Kubernetes Operator, or manual deployment to install Prometheus on your Kubernetes cluster. Ensure that the Prometheus server is configured to scrape pod metrics periodically.
Step 2: Configure Prometheus
Create a Prometheus configuration file to define which Kubernetes resources to monitor. Specify the targets, scrape intervals, and metrics to collect. For example:
“`yaml global: scrape_interval: 15s evaluation_interval: 15s scrape_configs:
job_name: ‘kubernetes-pods’
kubernetes_sd_configs:
role: pod
relabel_configs:
source_labels: [__meta_kubernetes_pod_label_app]
separator: ;
regex: (.+)
target_label: address
replacement: ${1}:${__meta_kubernetes_pod_container_port_name}
source_labels
Implementing Effective Alerting Strategies
Effective alerting strategies are crucial for Kubernetes pod monitoring to ensure timely issue detection and resolution. Follow these best practices to create meaningful alerts, avoid alert fatigue, and integrate alerts with incident management systems:
1. Define Clear Alert Conditions
Create alerts based on specific, actionable conditions. For example, instead of alerting on CPU usage above a certain threshold, alert when CPU usage remains high for an extended period. This approach helps to distinguish between temporary spikes and ongoing issues.
2. Set Appropriate Alert Thresholds
Determine alert thresholds based on your application’s performance and resource requirements. Consider factors such as application SLAs, business objectives, and historical performance data when setting thresholds.
3. Implement Alert Suppression
Suppress alerts for known, temporary issues or during maintenance windows to avoid alert fatigue. This can be done using label-based suppression rules or by integrating with external scheduling systems.
4. Use Alert Aggregation
Aggregate alerts based on common factors, such as Kubernetes namespaces, labels, or annotations. Alert aggregation helps reduce noise and provides a clearer overview of active issues.
5. Integrate Alerts with Incident Management Systems
Integrate your Kubernetes pod monitoring system with your incident management platform to streamline issue tracking, escalation, and resolution. This can help reduce response times and minimize the impact of issues on system health and availability.
6. Monitor Alert Effectiveness
Regularly review your alerting strategy to ensure it remains effective and relevant. Analyze alert data to identify false positives, false negatives, and alert fatigue. Adjust alert conditions, thresholds, and suppression rules as needed to improve overall alerting efficiency.
Maximizing Visibility with Logging and Tracing
Logging and tracing are essential components of Kubernetes pod monitoring, providing valuable insights into system behavior and performance. Collecting, aggregating, and analyzing logs and traces can help identify issues, optimize resource usage, and improve overall system reliability. This section discusses popular tools and best practices for logging and tracing in Kubernetes pod monitoring.
Collecting and Aggregating Logs
Collecting and aggregating logs from Kubernetes pods can be achieved using various tools, such as Fluentd, Loki, and Elasticsearch. These tools help gather logs from multiple sources, filter and process logs, and store them in a central location for further analysis.
Analyzing Logs
Analyzing logs involves searching, filtering, and visualizing log data to identify trends, patterns, and anomalies. Tools like Grafana, Kibana, and Loki provide powerful log analysis capabilities, enabling users to create custom dashboards, alerts, and visualizations based on log data.
Structured Logging
Structured logging involves adding a consistent, machine-readable format to log messages, making it easier to parse, filter, and analyze logs. Adopting structured logging practices can significantly improve log analysis efficiency and accuracy in Kubernetes pod monitoring.
Tracing
Tracing helps visualize the flow of requests through a distributed system, identifying bottlenecks, latency issues, and performance problems. Tools like Jaeger, Zipkin, and OpenTelemetry provide tracing capabilities for Kubernetes pod monitoring, enabling users to understand the behavior and performance of complex, microservices-based applications.
Traceability
Traceability involves maintaining a clear, consistent record of system events, changes, and configurations. Ensuring traceability in Kubernetes pod monitoring can help identify issues, track system evolution, and support compliance and auditing requirements.
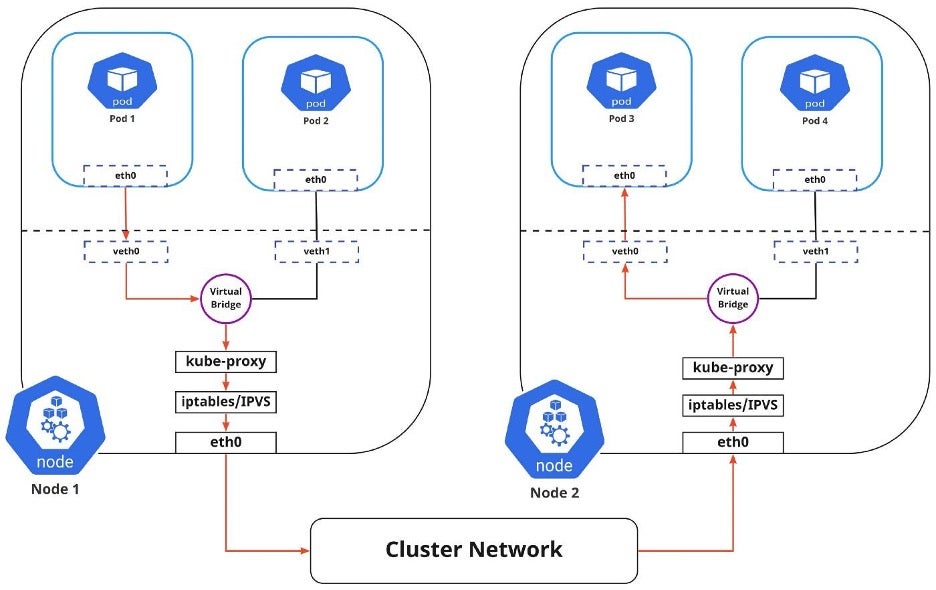
Monitoring Kubernetes Pod Networking
Monitoring Kubernetes pod networking is crucial for maintaining system health and performance. Kubernetes’ dynamic nature and the distributed architecture of pods introduce unique challenges in networking monitoring. Key aspects to consider when monitoring Kubernetes pod networking include service discovery, load balancing, and network latency. This section discusses best practices and tools for effective Kubernetes pod networking monitoring.
Service Discovery
Service discovery is the process of automatically identifying and registering services in a distributed system. Monitoring service discovery in Kubernetes pod networking involves tracking the availability and responsiveness of services and ensuring they are correctly registered with the Kubernetes service registry. Tools like Consul, Etcd, and Kubernetes service discovery mechanisms can help monitor service discovery in Kubernetes pod networking.
Load Balancing
Load balancing is the distribution of network traffic across multiple resources to optimize resource utilization and improve system performance. Monitoring load balancing in Kubernetes pod networking involves tracking the effectiveness of load balancing strategies, ensuring load balancers are correctly configured, and identifying potential bottlenecks. Tools like NGINX, HAProxy, and Kubernetes built-in load balancing mechanisms can help monitor load balancing in Kubernetes pod networking.
Network Latency
Network latency is the time it takes for data to travel from one point in the network to another. Monitoring network latency in Kubernetes pod networking involves tracking the time it takes for requests to travel between pods, services, and external systems. Identifying and addressing high network latency can significantly improve system performance and user experience. Tools like Prometheus, Istio, and Linkerd can help monitor network latency in Kubernetes pod networking.
Best Practices for Kubernetes Pod Networking Monitoring
To effectively monitor Kubernetes pod networking, follow these best practices:
- Use Kubernetes service annotations and labels to categorize and filter services and pods.
- Implement end-to-end monitoring to track network traffic from the user to the application and back.
- Monitor network policies and security groups to ensure proper access control and segmentation.
- Integrate networking monitoring with your overall Kubernetes monitoring strategy for a holistic view of system health.
Optimizing Kubernetes Pod Monitoring with Auto-Scaling
Auto-scaling is a powerful feature that can significantly improve Kubernetes pod monitoring by automatically adjusting the number of pod replicas based on resource utilization and performance metrics. This section discusses how to configure Kubernetes horizontal pod autoscaler and cluster autoscaler, as well as the benefits and limitations of auto-scaling in Kubernetes pod monitoring.
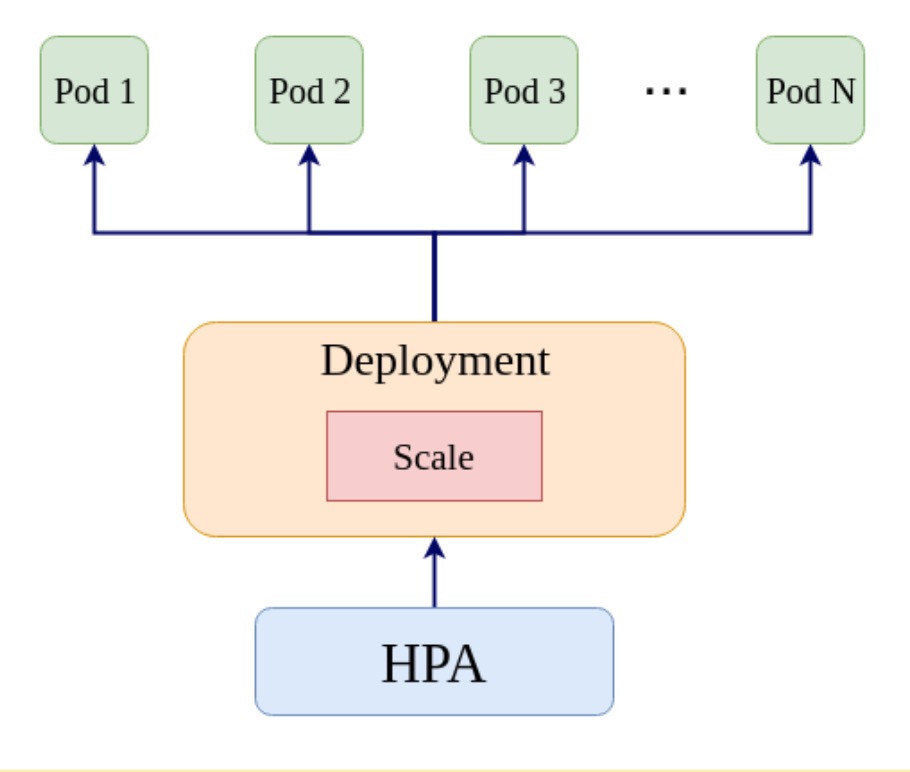
Kubernetes Horizontal Pod Autoscaler
The Kubernetes horizontal pod autoscaler (HPA) automatically scales the number of pod replicas in a deployment or replica set based on customizable metrics, such as CPU utilization or memory consumption. To configure HPA, follow these steps:
- Ensure the Metrics Server is running in your Kubernetes cluster.
- Create a Horizontal Pod Autoscaler using the
kubectl autoscalecommand or a YAML manifest. - Specify the minimum and maximum number of replicas, as well as the target CPU utilization or memory request.
- Monitor the HPA status using the
kubectl get hpacommand.
Kubernetes Cluster Autoscaler
The Kubernetes cluster autoscaler automatically adjusts the size of a node pool or worker nodes based on resource utilization and availability. To configure the cluster autoscaler, follow these steps:
- Ensure the Cluster Autoscaler is deployed and configured for your cloud provider or on-premises infrastructure.
- Configure the minimum and maximum number of nodes in the node pool or worker nodes.
- Monitor the cluster autoscaler status using the
kubectl describe cluster-autoscalercommand.
Benefits and Limitations of Auto-Scaling in Kubernetes Pod Monitoring
Auto-scaling offers several benefits for Kubernetes pod monitoring, including:
- Improved resource utilization and cost efficiency.
- Reduced manual intervention and management overhead.
- Faster response to changes in system load and performance.
However, auto-scaling also has limitations, such as:
- Potential performance instability due to rapid scaling events.
- Increased complexity in monitoring and managing auto-scaled resources.
- The need for careful configuration and tuning to avoid overscaling or underscaling.
Best Practices for Kubernetes Pod Monitoring with Auto-Scaling
To effectively use auto-scaling in Kubernetes pod monitoring, follow these best practices:
- Monitor auto-scaling events and resource utilization to ensure optimal performance and cost efficiency.
- Configure appropriate scaling thresholds and limits to prevent overscaling or underscaling.
- Implement meaningful alerting strategies to notify operators of auto-scaling events and resource utilization issues.
- Regularly review and adjust auto-scaling configurations based on system performance and business requirements.
Continuous Monitoring and Improvement
Continuous monitoring and improvement are essential for maintaining a healthy and efficient Kubernetes environment. By regularly reviewing monitoring data, identifying trends, and making data-driven decisions, you can optimize system performance, reduce costs, and enhance user experience. This section discusses best practices for continuous monitoring and improvement in Kubernetes pod monitoring.
Reviewing Monitoring Data
Regularly review monitoring data to identify patterns, trends, and anomalies in your Kubernetes pods’ performance and resource utilization. Use tools like Prometheus, Grafana, and Kubernetes Dashboard to visualize and analyze monitoring data, and consider setting up custom dashboards tailored to your specific needs.
Identifying Trends
Trend analysis is crucial for predicting future resource requirements, capacity planning, and identifying potential issues before they impact system performance. Monitor trends in resource utilization, application performance, and system events to make informed decisions about scaling, resource allocation, and configuration adjustments.
Making Data-Driven Decisions
Base your monitoring and optimization strategies on data, not assumptions or guesswork. Use monitoring data to identify bottlenecks, inefficiencies, and areas for improvement, and implement targeted solutions to address these issues. Continuously evaluate the impact of your changes and adjust your strategies as needed.
Best Practices for Continuous Monitoring and Improvement
To effectively implement continuous monitoring and improvement in Kubernetes pod monitoring, follow these best practices:
- Establish clear monitoring objectives and key performance indicators (KPIs) to guide your monitoring efforts.
- Implement a culture of continuous learning and improvement within your team.
- Regularly review monitoring data and adjust monitoring strategies as needed.
- Collaborate with cross-functional teams to ensure monitoring efforts align with business objectives and user needs.
- Document monitoring processes, configurations, and findings for future reference and auditing purposes.
Continuous Monitoring Tools and Techniques
In addition to Kubernetes-native monitoring tools, consider using third-party tools and techniques to enhance your continuous monitoring capabilities. These may include machine learning algorithms for anomaly detection, chaos engineering for resilience testing, and A/B testing for performance optimization.