
What is Power Bi and Why Create an App?
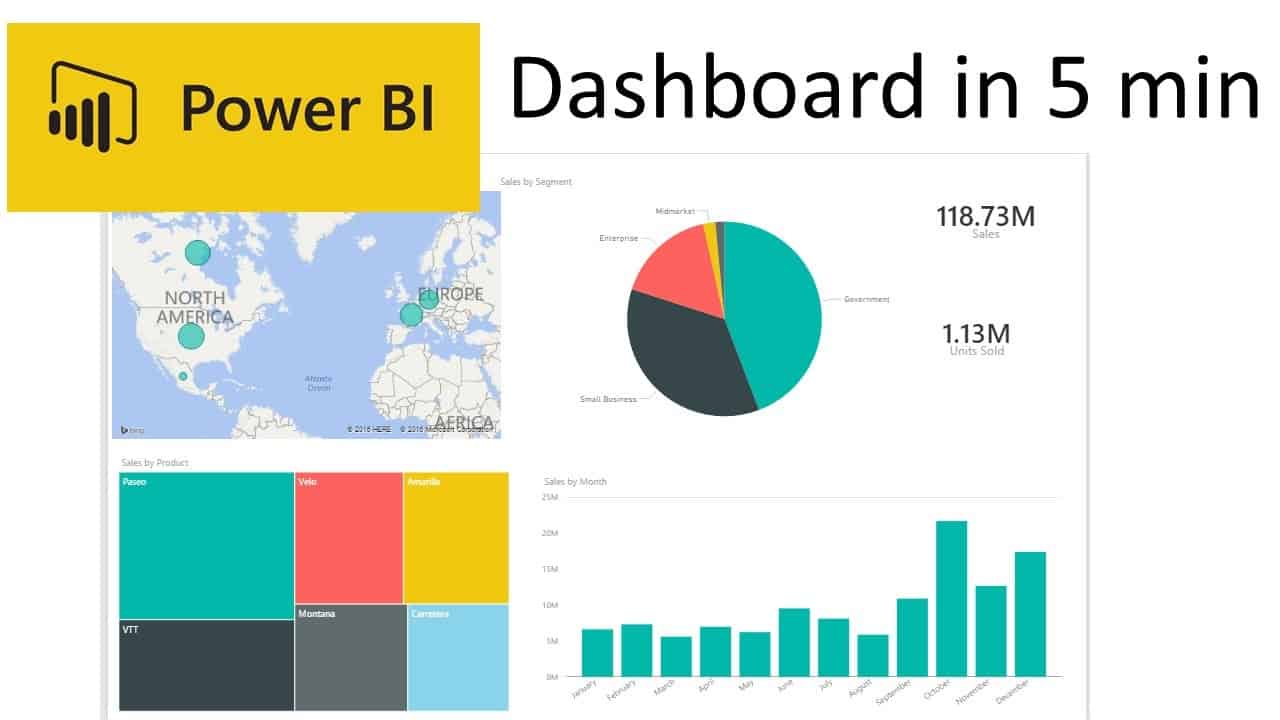
Power Bi is a powerful business analytics tool that enables users to visualize and analyze data in a more efficient and insightful way. With Power Bi, users can connect to various data sources, clean and transform the data, and create interactive reports and dashboards. By creating a Power Bi app, users can customize the tool to fit their specific needs, automate data refreshes, and share the app with others for collaboration and analysis.
There are several benefits to creating a Power Bi app, such as enhancing data analysis, improving productivity, and promoting data-driven decision-making. By creating a custom app, users can tailor the tool to their specific data sources, visualizations, and user experience, making it easier to access and analyze the data they need. Additionally, creating an app allows users to automate data refreshes, ensuring that the data is always up-to-date and accurate. Finally, sharing the app with others enables collaboration and analysis, promoting a data-driven culture within an organization.
In summary, Power Bi is a versatile business analytics tool that can be customized and automated through the creation of a Power Bi app. By defining the app’s purpose and target audience, planning the structure and layout, connecting to data sources, creating visualizations, adding interactivity, testing and refining the app, and publishing and sharing it with others, users can enhance their data analysis, improve productivity, and promote data-driven decision-making.

Identifying Your App’s Purpose and Audience
Defining the purpose and target audience of your Power Bi app is a crucial step in the development process. By identifying the app’s purpose, you can ensure that it aligns with your business goals and objectives. By understanding your target audience, you can tailor the app’s features and functionality to meet their needs and preferences.
When defining the app’s purpose, consider the following factors: the type of data you want to analyze, the insights you hope to gain, and the actions you want to take based on the data. For example, if you want to analyze sales data to identify trends and opportunities, your app’s purpose might be to provide sales performance reports and dashboards. By clearly defining the app’s purpose, you can ensure that it provides value and usefulness to the user.
Similarly, understanding your target audience is essential to creating a successful Power Bi app. Consider factors such as the user’s role, their data needs, and their technical skills. For example, if your target audience is sales managers, they may require access to sales performance data, while technical skills may be limited. In this case, you can create a user-friendly app with simple visualizations and reports, making it easy for the user to access and analyze the data they need.
By identifying the app’s purpose and target audience, you can ensure that the app meets the user’s needs and provides value to the organization. This step is critical in creating a successful Power Bi app that enhances data analysis, improves productivity, and promotes data-driven decision-making.
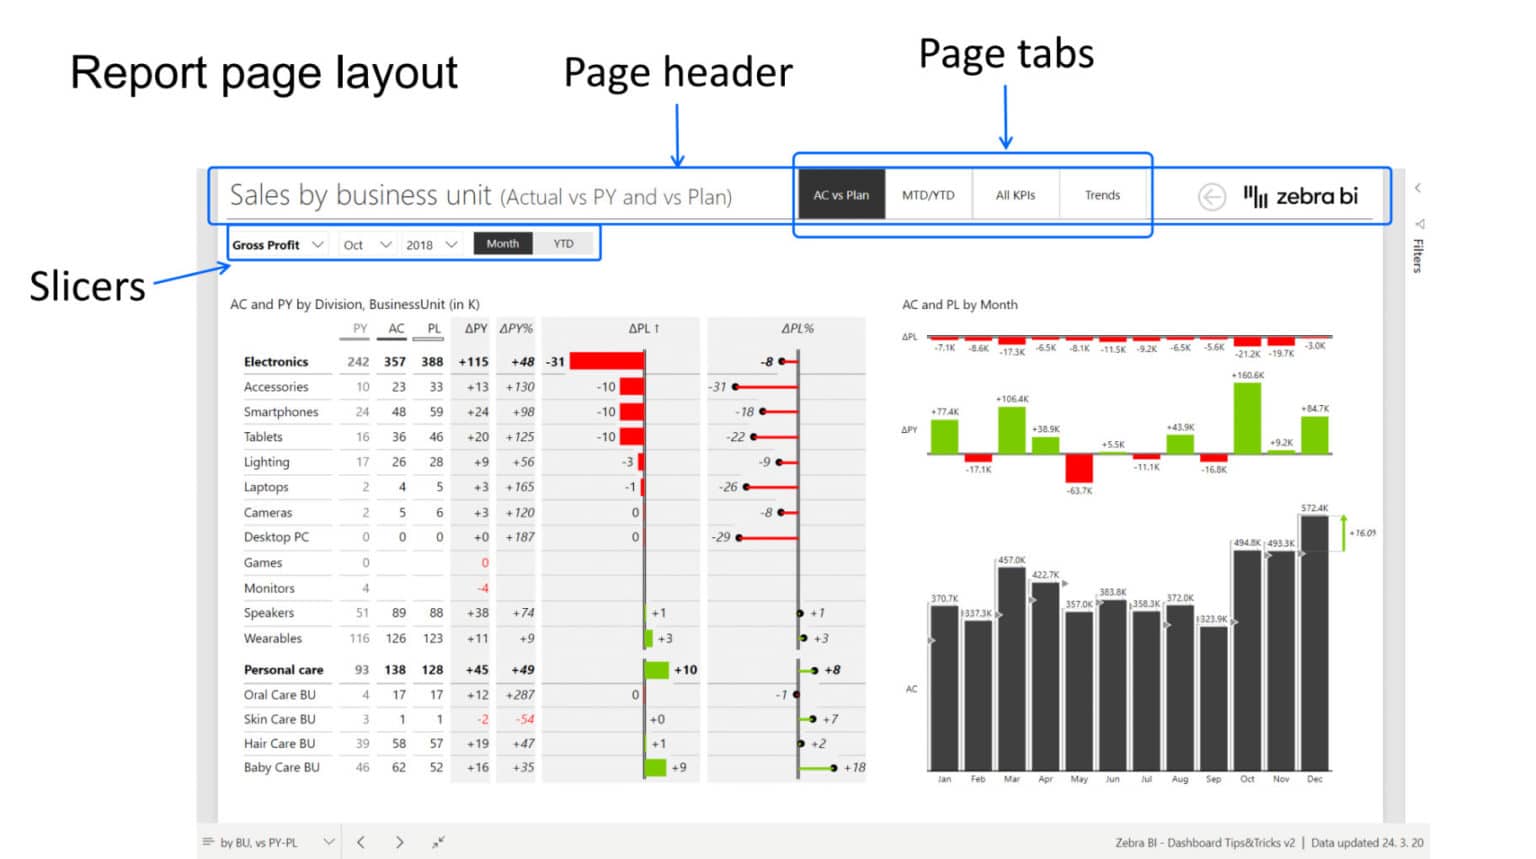
Planning Your App’s Structure and Layout
Planning the structure and layout of your Power Bi app is essential to creating a user-friendly and effective app. By organizing your data, creating visualizations, and ensuring a user-friendly design, you can enhance the user’s experience and provide valuable insights into the data.
When planning the app’s structure, consider the following tips: organize the data into logical groups, use clear and concise naming conventions, and create a hierarchical structure. By organizing the data into logical groups, you can make it easier for the user to find and analyze the data they need. By using clear and concise naming conventions, you can ensure that the user understands the data and its meaning. By creating a hierarchical structure, you can provide a clear and organized view of the data, making it easier for the user to navigate and analyze.
Creating effective visualizations is also crucial in planning the app’s layout. Use charts, tables, and maps to display the data in a clear and concise way. Consider the user’s needs and preferences when creating visualizations. For example, if the user is a sales manager, they may prefer to see sales performance data in a chart format. By creating effective visualizations, you can enhance the user’s experience and provide valuable insights into the data.
Ensuring a user-friendly design is also essential in planning the app’s layout. Use clear and concise labels, provide tooltips and help text, and use a consistent color scheme. By using clear and concise labels, you can ensure that the user understands the data and its meaning. By providing tooltips and help text, you can provide additional context and information to the user. By using a consistent color scheme, you can create a visually appealing and easy-to-use app.
By planning the app’s structure and layout, you can ensure that the app is user-friendly, effective, and provides valuable insights into the data. This step is critical in creating a successful Power Bi app that enhances data analysis, improves productivity, and promotes data-driven decision-making.

Connecting to Data Sources and Preparing Data
Connecting to data sources and preparing data is a crucial step in creating a Power Bi app. By connecting to various data sources, such as Excel, SQL Server, and Power BI datasets, you can access the data you need for analysis. By cleaning, transforming, and shaping the data, you can ensure that it is accurate, consistent, and ready for analysis.
To connect to data sources, follow these steps:
- Open Power Bi and select “Get Data” from the Home tab.
- Choose the data source you want to connect to, such as Excel or SQL Server.
- Follow the prompts to connect to the data source and select the data you want to import.
- Transform and shape the data as needed using Power Query Editor.
Power Query Editor is a powerful tool that allows you to clean, transform, and shape your data. Use it to remove duplicates, filter data, split columns, and more. By preparing the data in this way, you can ensure that it is accurate, consistent, and ready for analysis.
When preparing data, consider the following tips:
- Remove any unnecessary data to reduce clutter and improve performance.
- Ensure that the data is consistent and follows a standard format.
- Clean the data by removing errors, missing values, and outliers.
- Transform the data by splitting columns, merging data, and creating new calculations.
By connecting to data sources and preparing data, you can ensure that your Power Bi app has access to accurate, consistent, and ready-to-analyze data. This step is critical in creating a successful Power Bi app that enhances data analysis, improves productivity, and promotes data-driven decision-making.

Creating Visualizations and Reports
Creating effective visualizations and reports is a crucial step in developing a Power Bi app. By using charts, tables, and maps, you can display data in a clear and concise way, making it easier for users to understand and analyze the data. In this section, we will provide guidance on how to create effective visualizations and reports using Power Bi’s tools and features.
To create a visualization, follow these steps:
- Select the data you want to visualize.
- Choose the visualization type you want to use, such as a bar chart or pie chart.
- Customize the visualization by adding fields, formatting, and applying filters.
- Save the visualization and add it to a report.
Power Bi offers a wide range of visualization types, including charts, tables, maps, and more. Choose the visualization type that best suits your data and the insights you want to convey. For example, use a bar chart to compare data across categories, or a pie chart to show the proportion of different categories.
Customizing visualizations is also important in creating effective visualizations. Use formatting options to change the color, size, and style of visualizations. Apply filters to drill down into the data and focus on specific data points. By customizing visualizations, you can ensure that they are clear, concise, and easy to understand.
Creating reports is the final step in visualizing data. Use Power Bi’s report editor to add visualizations to a report, arrange them on the page, and add titles and formatting. Reports can be exported as PDFs or shared with others through Power Bi’s sharing capabilities.
By creating effective visualizations and reports, you can ensure that your Power Bi app is user-friendly, engaging, and provides valuable insights into the data. This step is critical in creating a successful Power Bi app that enhances data analysis, improves productivity, and promotes data-driven decision-making.
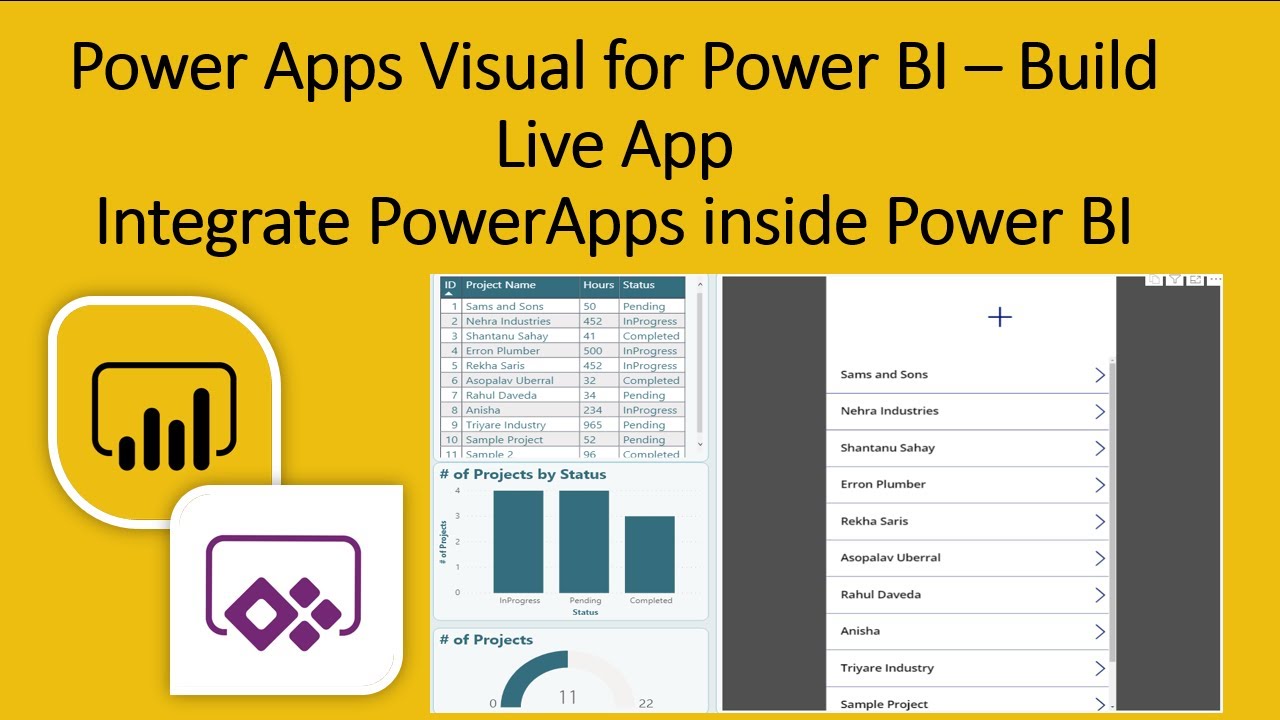
Adding Interactivity and Advanced Features
Adding interactivity and advanced features to your Power Bi app can enhance user engagement and analysis. By using filters, slicers, and drill-down capabilities, you can provide users with a more dynamic and interactive experience. In this section, we will showcase how to add interactivity and advanced features to your Power Bi app.
Filters are a powerful tool that allows users to focus on specific data points. Power Bi offers a variety of filter options, including basic filters, advanced filters, and visual-level filters. Use filters to drill down into the data and focus on specific categories, time periods, or data points. By providing filters, you can give users more control over the data and enable them to find the insights they need.
Slicers are another interactive feature that allows users to filter data. Slicers are visual filters that can be added to reports and dashboards. Use slicers to provide users with an easy-to-use interface for filtering data. Slicers can be customized with different visual styles and formatting options, making them a flexible and versatile tool for filtering data.
Drill-down capabilities allow users to explore data at different levels of detail. Use drill-down capabilities to provide users with a more detailed view of the data. Drill-down capabilities can be added to charts, tables, and other visualizations. By providing drill-down capabilities, you can enable users to explore the data in more depth and uncover insights that might otherwise go unnoticed.
Adding interactivity and advanced features to your Power Bi app can provide users with a more engaging and dynamic experience. By using filters, slicers, and drill-down capabilities, you can enable users to find the insights they need and make data-driven decisions. This step is critical in creating a successful Power Bi app that enhances data analysis, improves productivity, and promotes data-driven decision-making.

Testing and Refining Your App
Testing and refining your Power Bi app is a crucial step in the development process. By validating data accuracy, user experience, and performance, you can ensure that your app is effective, efficient, and user-friendly. In this section, we will discuss the importance of testing and refining your app, and provide tips on how to do so.
Validating data accuracy is essential in creating a successful Power Bi app. Use Power Bi’s data profiling and data lineage tools to identify any data quality issues, such as missing values, inconsistent formatting, or incorrect data types. By validating data accuracy, you can ensure that your app provides reliable and trustworthy insights.
User experience is another critical factor to consider when testing and refining your app. Use Power Bi’s built-in testing tools, such as the Performance Analyzer and the Test Framework, to identify any performance issues or usability problems. By testing the user experience, you can ensure that your app is easy to use, efficient, and meets the needs of your target audience.
Performance is also an important consideration when testing and refining your app. Use Power Bi’s performance monitoring tools to identify any bottlenecks or performance issues. By optimizing the performance of your app, you can ensure that it runs smoothly and efficiently, even with large datasets.
Testing and refining your Power Bi app is an ongoing process. Continuously monitor the app’s performance, data accuracy, and user experience, and make adjustments as needed. By testing and refining your app, you can ensure that it provides valuable insights, enhances data analysis, improves productivity, and promotes data-driven decision-making.
Publishing and Sharing Your App
Once you have developed and tested your Power Bi app, it’s time to publish and share it with others. Power Bi offers a variety of options for publishing and sharing your app, including embedding the app in a website, sharing with specific users, and setting up access controls. In this section, we will provide guidance on how to publish and share your Power Bi app.
Embedding the app in a website is a great way to make it accessible to a wider audience. Use Power Bi’s embedding features to embed the app in a web page or application. By embedding the app, you can provide users with easy access to the app, without requiring them to log in to Power Bi. You can also customize the appearance and behavior of the embedded app, to match the look and feel of your website or application.
Sharing the app with specific users is another option for publishing and sharing your Power Bi app. Use Power Bi’s sharing features to invite specific users to view or interact with the app. You can control the level of access that each user has, by setting up permissions and access controls. By sharing the app with specific users, you can ensure that the right people have access to the right data, and that data is protected and secure.
Setting up access controls is an important step in publishing and sharing your Power Bi app. Use Power Bi’s security features to control who can access the app, and what they can do with it. You can set up role-based access controls, to assign different levels of access to different users. You can also set up row-level security, to restrict access to specific rows of data. By setting up access controls, you can ensure that your app is secure, and that data is protected.
Publishing and sharing your Power Bi app is the final step in the development process. By embedding the app in a website, sharing it with specific users, and setting up access controls, you can ensure that your app is accessible, secure, and provides valuable insights to your target audience. By publishing and sharing your app, you can enhance data analysis, improve productivity, and promote data-driven decision-making.
