What is Prometheus and How Does it Operate?
Prometheus is an open-source monitoring system that has gained popularity due to its unique data model and powerful query language. It focuses on collecting time series data, which are sets of data points collected over time, and storing them in an efficient and flexible manner. The system is designed to be highly available and scalable, allowing it to handle large amounts of data and numerous targets.
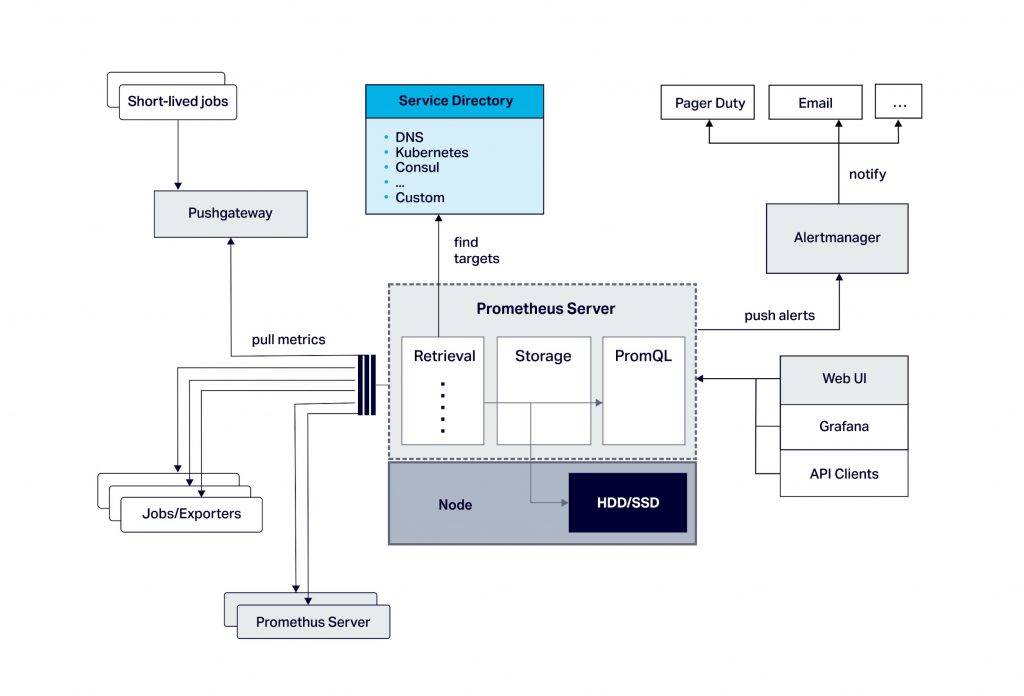
At its core, Prometheus consists of several main components, including the Prometheus server, client libraries, and exporters. The Prometheus server is responsible for collecting, storing, and querying data, while client libraries and exporters enable integration with various systems and applications. This modular architecture allows Prometheus to be highly adaptable and customizable, catering to diverse monitoring needs.

Prometheus Data Model and Query Language (PromQL): A Closer Look
Prometheus’ data model is based on a simple yet powerful concept: time series data. A time series is a collection of data points, each consisting of a timestamp and a value, that are associated with a specific metric and a set of labels. This data model enables efficient storage and retrieval of large volumes of monitoring data, making it an ideal choice for organizations with extensive monitoring needs.
Prometheus’ query language, PromQL, is a flexible and expressive tool for querying and aggregating time series data. With PromQL, users can create complex queries that combine multiple metrics, apply various functions and aggregation operations, and filter data based on labels. This powerful querying capability allows for in-depth analysis and visualization of monitoring data, facilitating informed decision-making and problem identification.
Here are some examples of basic and advanced PromQL queries:
- Basic query:
http_requests_total– Retrieves the total number of HTTP requests. - Range query:
sum(http_requests_total[1h])– Calculates the sum of HTTP requests over the past hour. - Aggregation query:
avg(http_requests_total{method="post"})– Computes the average number of HTTP POST requests. - Comparison query:
Setting Up a Prometheus Monitoring Environment: A Step-by-Step GuideTo get started with Prometheus, follow these steps to install, configure, and set up your monitoring environment:
- Install Prometheus: Download and install the Prometheus software on your target system. You can find the latest release and installation instructions on the Prometheus download page.
- Configure Prometheus: Create a Prometheus configuration file (
prometheus.yml) to define your monitoring targets, rules, and alerts. Here’s a basic example:
{ global: scrape_interval: 15s evaluation_interval: 15s scrape_configs: job_name: 'prometheus' static_configs: targets: ['localhost:9090'] }- Start Prometheus: Run the Prometheus server using the configuration file:
./prometheus --config.file=prometheus.yml- Set up monitoring targets

Integrating Prometheus with Existing Systems and Applications
Prometheus can be easily integrated with various popular systems and applications to enhance monitoring capabilities. Here are some common integration methods and tools:
Kubernetes
Prometheus offers a dedicated Kubernetes operator to simplify integration and management. The operator automates the deployment, configuration, and scaling of Prometheus components in a Kubernetes environment. Additionally, Prometheus can scrape Kubernetes API servers, nodes, and pods to collect monitoring data.
Docker
Prometheus can monitor Docker containers using the
docker_sd_configscrape configuration. This method allows Prometheus to automatically discover and monitor running Docker containers. Moreover, you can use the Prometheus Docker plugin to collect additional metrics, such as container resource usage and network statistics.Grafana
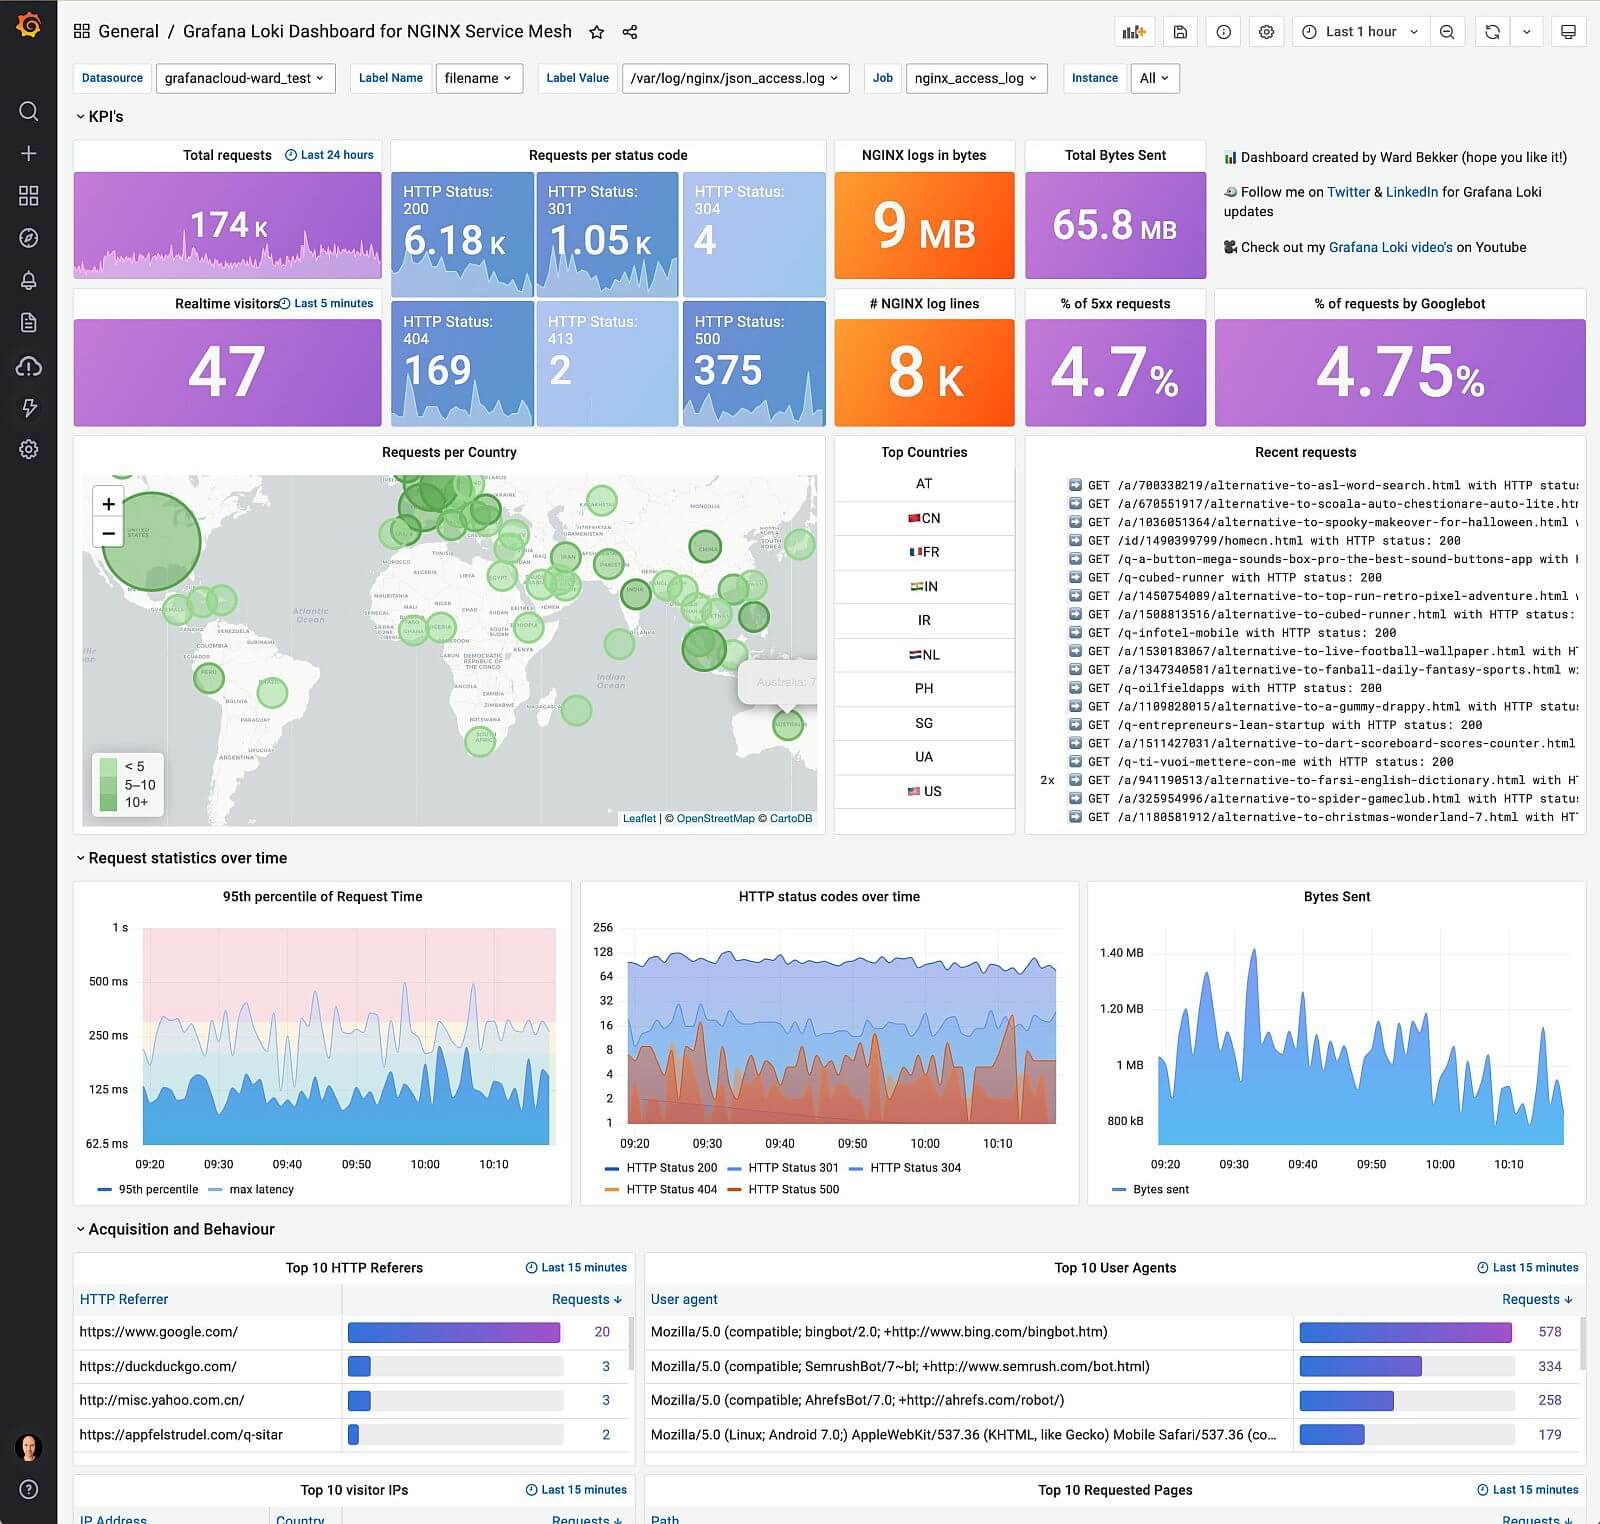
Prometheus can be integrated with Grafana, a popular visualization tool, to create custom dashboards and visualizations. To set up the integration, configure Prometheus as a data source in Grafana and start building your monitoring dashboards. Grafana offers a wide range of visualization options, including graphs, tables, and heatmaps, enabling you to effectively analyze and display your monitoring data.
Other Systems and Applications
Prometheus provides client libraries and exporters for various programming languages and frameworks, such as Java, Python, and Ruby. These libraries and exporters enable you to instrument your applications and services, exposing custom metrics for monitoring. By using these tools, you can seamlessly integrate Prometheus with your existing systems and applications, extending your monitoring capabilities.
Exploring Prometheus’ Alertmanager: Managing and Responding to Alerts
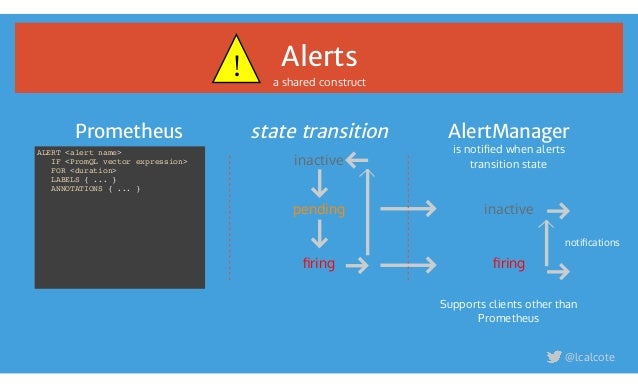
Prometheus includes a powerful alerting system called Alertmanager, designed to manage and respond to alerts generated by the Prometheus server. Alertmanager enables you to route, deduplicate, and aggregate alerts, ensuring that the right people are notified at the right time. Here’s a closer look at how to create, manage, and respond to alerts effectively using Alertmanager:
Creating Alerts in Prometheus
To create alerts in Prometheus, define alerting rules in the
prometheus.ymlconfiguration file. Alerting rules consist of a query that defines the alert condition and an optional message to provide context when the alert is triggered. Here’s an example:groups: - name: example rules: - alert: HighRequestLatency expr: job:request_latency_seconds:mean5m{job="my_job"} > 0.5 for: 10m annotations: description: Request latency is too high for job "my_job"Configuring Alertmanager
To configure Alertmanager, create a separate configuration file (
alertmanager.yml) and define routes, receivers, and inhibition rules. Here’s a basic example:{ global: resolve\_timeout: 5m route: receiver: "team-X-mails" routes: - match: severity: critical receiver: "team-X-mails-high" receivers: name: "team-X-mails" email_configs: to: "[email protected]" name: "team-X-mails-high" email_configs: to: "[email protected]" }Responding to Alerts
When alerts are triggered, Alertmanager sends notifications to the configured receivers, such as email, Slack, or PagerDuty. By setting up different receivers and routes, you can ensure that the right people are notified based on the alert severity and other factors. This allows your team to quickly respond to critical issues and maintain optimal system performance.
Visualizing Prometheus Data with Grafana: A Comprehensive Guide
Prometheus provides a powerful query language and efficient data storage, but its visualization capabilities are somewhat limited. To create custom dashboards and visualizations, you can integrate Prometheus with Grafana, a popular open-source visualization tool. Here’s a step-by-step guide on how to integrate Prometheus with Grafana and create custom dashboards to display and analyze your monitoring data:
Installing Grafana
To install Grafana, download the appropriate package for your operating system from the Grafana download page. After downloading, follow the installation instructions for your platform. Once installed, start the Grafana service and access the web interface using your web browser.
Adding Prometheus as a Data Source
To add Prometheus as a data source in Grafana, follow these steps:
- In Grafana, click on the Gear icon (Configuration) and select Data Sources.
- Click on the Add data source button and select Prometheus from the list of available data sources.
- Enter the Prometheus server URL (e.g.,
http://localhost:9090) and provide a Name for the data source. Optionally, you can adjust the HTTP Headers and Security settings if required. - Click on the Save & Test button to save the data source and test the connection to the Prometheus server.
Creating Custom Dashboards
To create custom dashboards in Grafana, follow these steps:
- In Grafana, click on the Home icon and select Create > Dashboard.
- Click on the Add panel button and select Graph or any other visualization type you prefer.
- In the Metrics tab, select the Prometheus data source and enter the desired Metric query (e.g.,
node_memory_MemTotal). - Customize the visualization settings, such as Legend, Axes, and Display style, as needed.
- Click on the Apply button to save the panel and view the visualization.
- Repeat the process to add more panels and create a comprehensive dashboard for your monitoring data.
By integrating Prometheus with Grafana, you can create custom dashboards and visualizations that help you better understand and analyze your monitoring data. This combination of tools enables you to quickly identify trends, outliers, and potential issues, ensuring optimal system performance and reliability.
Best Practices for Prometheus Monitoring: Tips and Tricks
Prometheus is a powerful open-source monitoring system that offers numerous benefits for organizations seeking to monitor their IT infrastructure and applications. To get the most out of Prometheus, it’s essential to follow best practices for monitoring. Here are some tips and tricks to help you optimize your Prometheus monitoring experience:
Optimizing Data Retention
Prometheus stores monitoring data in local storage, which can consume significant disk space over time. To manage disk usage, you can configure data retention policies that define how long to keep data for various use cases. For example, you might keep detailed metrics for a short period (e.g., 1 day) and aggregated metrics for a more extended period (e.g., 30 days). This approach ensures that you have enough data to analyze trends and outliers without consuming excessive disk space.
Managing Storage
Prometheus stores monitoring data in a custom data format called the Prometheus data format. To ensure data durability and availability, it’s essential to configure regular backups of your Prometheus data. You can use tools like prom-tool to export Prometheus data to an external storage system, such as an object store or a relational database. This approach enables you to recover from data loss or corruption and ensures that you can access historical monitoring data even if your Prometheus server is offline.
Ensuring Data Security
Monitoring data can contain sensitive information, such as system performance metrics, user activity, and application errors. To protect your monitoring data, you should implement security measures, such as encryption, access controls, and auditing. For example, you can configure Prometheus to use secure communication protocols, such as HTTPS, and enable authentication and authorization using tools like Prometheus’ built-in authentication or Prometheus Basic Auth.
Monitoring Prometheus Itself
Prometheus is a critical component of your monitoring infrastructure, so it’s essential to monitor its performance and availability. You can use Prometheus to monitor itself by setting up targets that scrape metrics from the Prometheus server, such as
prometheus_build_info,prometheus_sd_config_info, andprometheus_target_info. By monitoring Prometheus, you can ensure that it’s running smoothly and detect issues before they impact your monitoring capabilities.Using Prometheus in Production
Prometheus is designed for production use, but it’s essential to follow best practices for deploying and managing Prometheus in a production environment. For example, you should use a dedicated monitoring server with sufficient resources, configure Prometheus to use persistent storage, and set up automatic failover and disaster recovery mechanisms. By following these best practices, you can ensure that your Prometheus monitoring system is reliable, scalable, and resilient.
Comparing Prometheus to Alternative Monitoring Solutions: Pros and Cons
Prometheus is a powerful open-source monitoring system with a unique data model and query language. However, it’s essential to compare Prometheus to other popular monitoring solutions to help you make informed decisions. Here, we’ll compare Prometheus to Nagios, Zabbix, and Datadog, highlighting their strengths and weaknesses:
Prometheus vs. Nagios
Nagios is a widely used open-source monitoring system that focuses on availability and performance monitoring. While Nagios has a large user community and extensive plugin ecosystem, it lacks Prometheus’ flexible query language and time series data model. Prometheus, on the other hand, offers more advanced analytics and visualization capabilities, making it a better choice for organizations seeking to perform complex monitoring and analysis tasks.
Prometheus vs. Zabbix
Zabbix is another popular open-source monitoring system that supports availability, performance, and network monitoring. Zabbix offers a user-friendly web interface, extensive reporting capabilities, and a wide range of pre-built templates. However, Zabbix’s data model is less flexible than Prometheus’, and its query language is less powerful. Prometheus’ simplicity, ease of use, and flexible data model make it a better choice for organizations seeking to monitor modern, dynamic infrastructure.
Prometheus vs. Datadog
Datadog is a commercial monitoring solution that offers availability, performance, and network monitoring, as well as log management and APM capabilities. Datadog offers a user-friendly web interface, extensive integrations, and advanced analytics and visualization capabilities. However, Datadog can be expensive, especially for organizations with large monitoring needs. Prometheus, on the other hand, is a free and open-source solution that offers similar capabilities, making it a better choice for organizations seeking to reduce monitoring costs.
Choosing the Right Monitoring Solution
When choosing a monitoring solution, it’s essential to consider your organization’s unique monitoring needs, budget, and expertise. While Prometheus offers advanced analytics and visualization capabilities, it may not be the best choice for organizations seeking a simple, user-friendly monitoring solution. On the other hand, commercial monitoring solutions like Datadog may offer more advanced features and integrations, but they can be expensive and complex to set up and manage. By comparing Prometheus to other popular monitoring solutions, you can make an informed decision that meets your organization’s monitoring needs and budget.