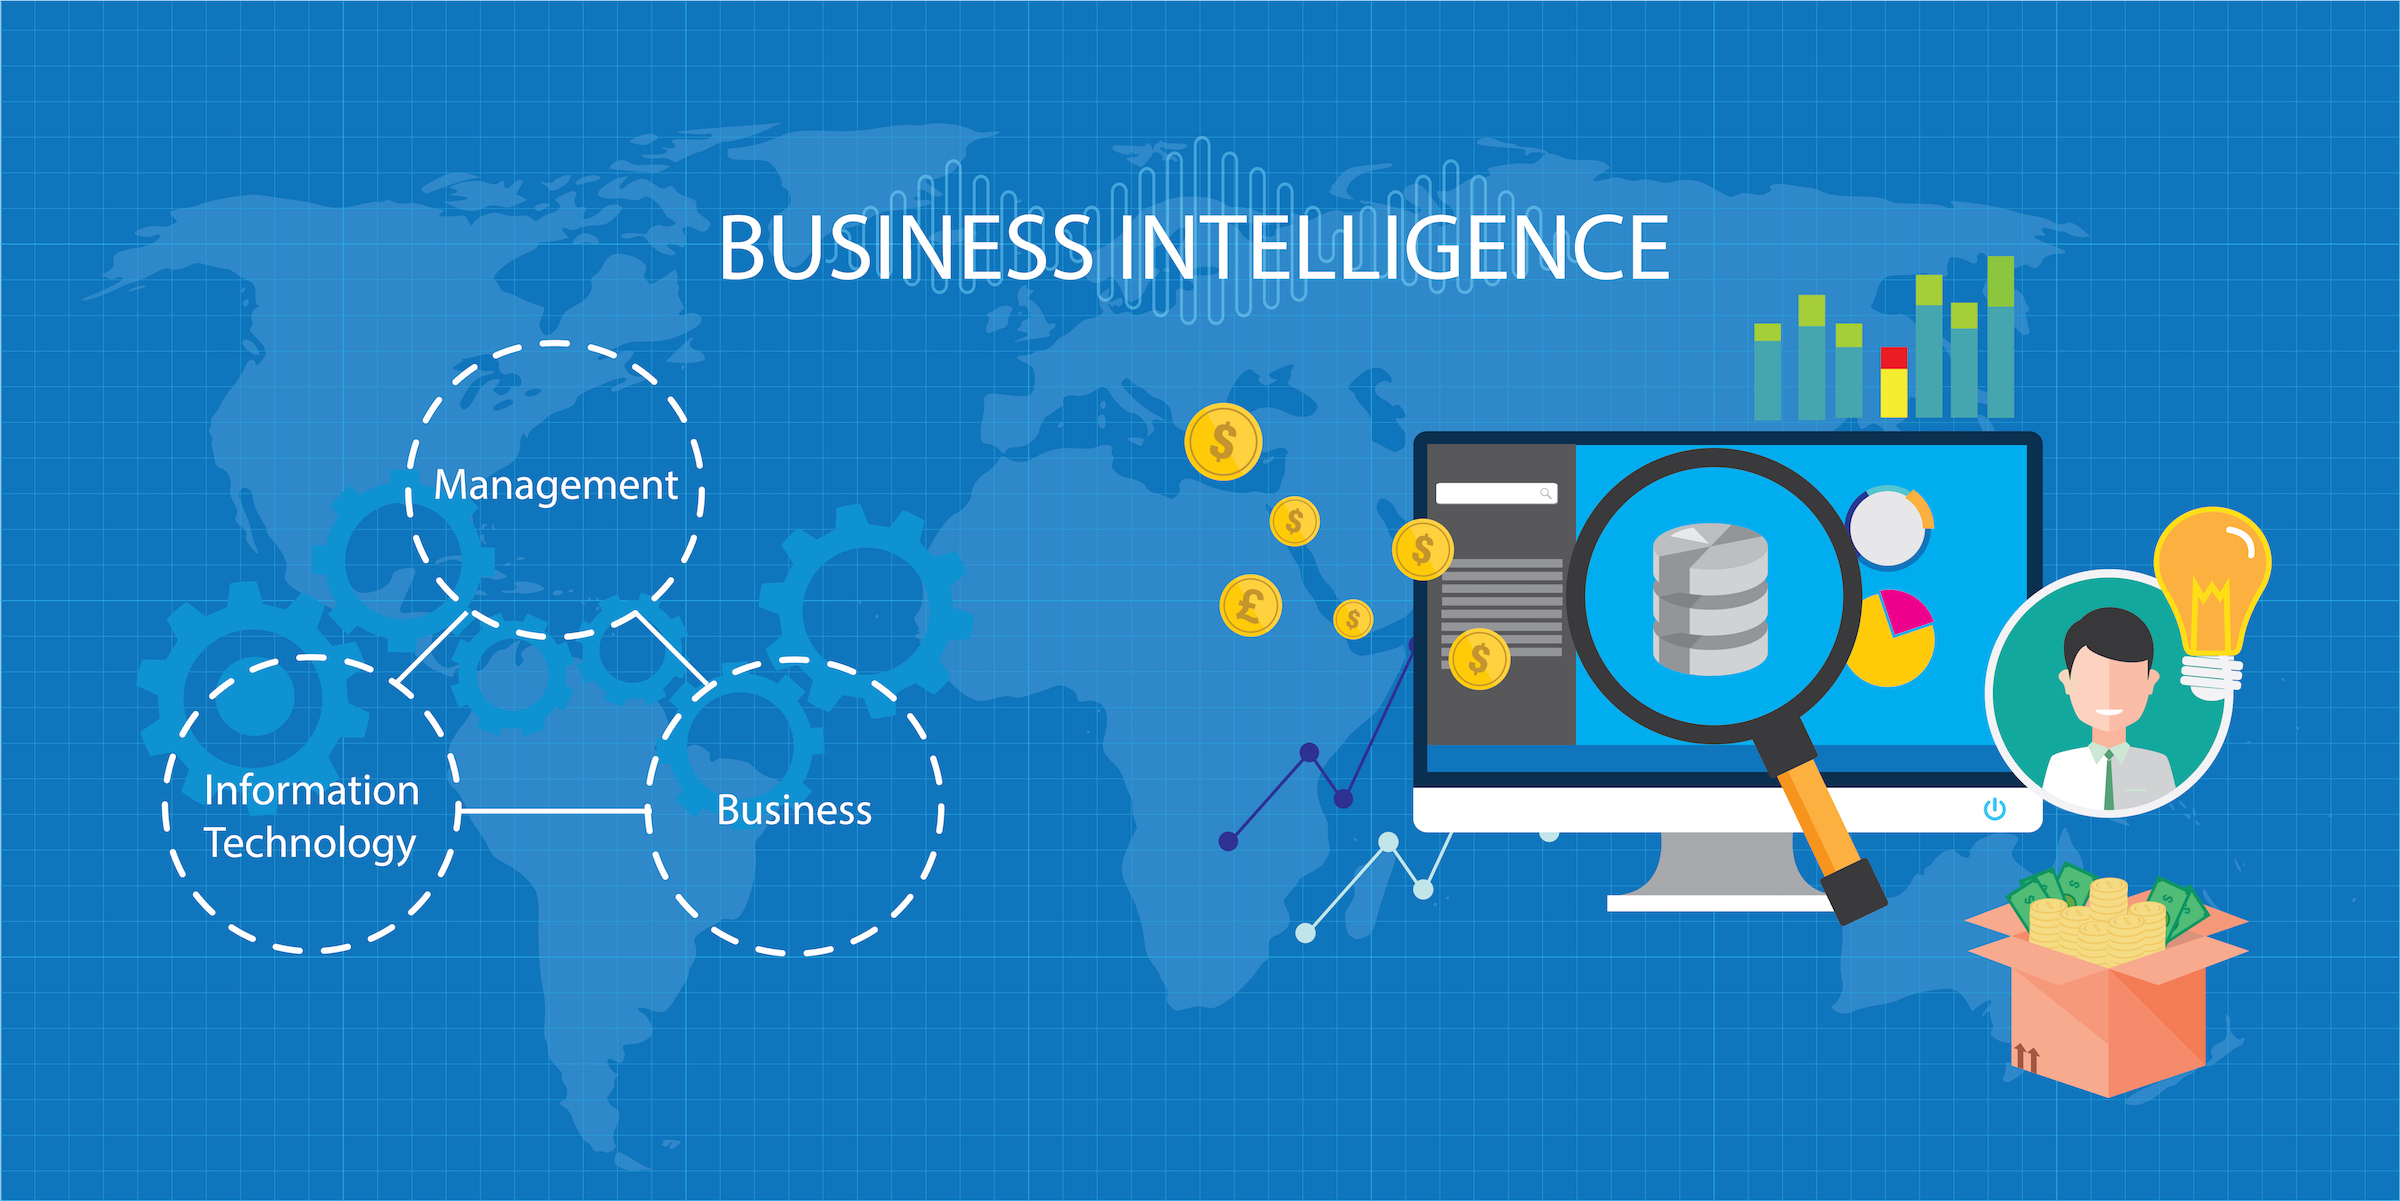
What is Bi Analysis and Why is it Important?
Bi analysis is the process of analyzing data to extract insights and support decision-making in organizations. It is a key component of business intelligence, which involves the use of technology, data analytics, and business insights to drive business growth and performance. Bi analysis enables organizations to collect, store, process, and analyze large volumes of data from various sources, including internal systems, external sources, and social media. Bi analysis is important for several reasons. Firstly, it helps organizations make informed decisions based on data rather than intuition or guesswork. By analyzing data, organizations can identify trends, patterns, and correlations that would otherwise go unnoticed. This, in turn, can help organizations optimize their operations, improve their products and services, and identify new opportunities.
Secondly, Bi analysis can help organizations improve their performance by identifying areas for improvement and providing insights into how to address them. For example, Bi analysis can help organizations identify inefficiencies in their supply chain, optimize their pricing strategies, or improve their customer service.
Thirdly, Bi analysis can help organizations gain a competitive advantage by providing insights into market trends, customer behavior, and competitor activity. By analyzing data, organizations can anticipate market changes, identify new revenue streams, and differentiate themselves from their competitors.
In summary, Bi analysis is a critical component of business intelligence that enables organizations to make informed decisions, improve their performance, and gain a competitive advantage. By analyzing data from various sources, organizations can gain insights into market trends, customer behavior, and competitor activity, and use this information to drive business growth and success.
Key Components of Bi Analysis
Bi analysis is a complex field that involves several key components. These components include data warehousing, data mining, reporting and visualization, and predictive analytics. Data warehousing is the process of collecting, storing, and managing large volumes of data from various sources. A data warehouse is a centralized repository that allows organizations to store data in a structured and organized manner. Data warehousing enables organizations to perform complex queries and analysis on large datasets, which would be difficult or impossible to do using traditional databases.
Data mining is the process of extracting insights and knowledge from large datasets. Data mining involves the use of statistical and machine learning algorithms to identify patterns, correlations, and trends in data. Data mining can help organizations identify opportunities, detect fraud, and optimize their operations.
Reporting and visualization are critical components of Bi analysis. Reporting involves the creation of reports and dashboards that provide insights into business performance. Visualization involves the use of charts, graphs, and other visual aids to help organizations understand their data. Reporting and visualization enable organizations to communicate their findings effectively to stakeholders and decision-makers.
Predictive analytics is the process of using data to make predictions about future events. Predictive analytics involves the use of statistical and machine learning algorithms to analyze historical data and identify patterns and trends. Predictive analytics can help organizations anticipate future events, such as customer churn, fraud, or equipment failures, and take proactive measures to address them.
How to Choose the Right Bi Analysis Tool
Choosing the right Bi analysis tool is a critical decision for any organization. With so many options available, it can be challenging to determine which tool is the best fit for your needs. Here are some factors to consider when selecting a Bi analysis tool:
Data integration: Look for a tool that can easily integrate with your existing data sources. The tool should be able to handle a variety of data formats, including structured and unstructured data.
Scalability: Choose a tool that can scale with your organization’s needs. As your organization grows, your Bi analysis tool should be able to handle an increasing volume of data.
Ease of use: Select a tool that is user-friendly and easy to learn. The tool should have an intuitive interface that allows users to create reports and visualizations without requiring extensive technical skills.
Cost: Consider the cost of the tool and whether it fits within your organization’s budget. Keep in mind that the most expensive tool is not necessarily the best fit for your needs.
Features and functionality: Look for a tool that has the features and functionality you need to perform your Bi analysis. Consider the types of reports and visualizations you need to create, as well as any advanced analytics capabilities you may require.
Vendor support: Choose a vendor that provides excellent support and has a strong reputation in the industry. Look for a vendor that offers training, certification, and other resources to help you get the most out of your Bi analysis tool.
Some of the leading Bi analysis tools available today include Tableau, Power BI, QlikView, and Looker. Each of these tools has its own strengths and weaknesses, so it’s essential to do your research and choose the one that best fits your organization’s needs.
Top Bi Analysis Tools in the Market
When it comes to Bi analysis tools, there are many options available in the market. Here are some of the leading Bi analysis tools that organizations can consider:
Tableau: Tableau is a popular Bi analysis tool that offers a range of features for data visualization and reporting. It supports a wide range of data sources and allows users to create interactive dashboards and reports. Tableau is known for its ease of use and flexibility.
Power BI: Power BI is a cloud-based Bi analysis tool from Microsoft that offers powerful data visualization and reporting capabilities. It supports a wide range of data sources and allows users to create interactive reports and dashboards. Power BI is also known for its integration with other Microsoft products, such as Excel and SharePoint.
QlikView: QlikView is a Bi analysis tool that offers a unique approach to data visualization and reporting. It uses an associative data model that allows users to explore data in a more intuitive way. QlikView is known for its powerful analytics capabilities and ability to handle large volumes of data.
Looker: Looker is a cloud-based Bi analysis tool that offers a range of features for data visualization and reporting. It supports a wide range of data sources and allows users to create interactive dashboards and reports. Looker is known for its ease of use and ability to handle complex data models.
Sisense: Sisense is a Bi analysis tool that offers a range of features for data visualization and reporting. It supports a wide range of data sources and allows users to create interactive dashboards and reports. Sisense is known for its ability to handle large volumes of data and its powerful analytics capabilities.
When choosing a Bi analysis tool, organizations should consider factors such as data integration, scalability, ease of use, and cost. They should also consider the specific needs of their organization and their users. It’s important to choose a tool that offers the right balance of features, functionality, and ease of use. By selecting the right Bi analysis tool, organizations can unlock the full potential of their data and make more informed decisions.
How to Implement Bi Analysis in Your Organization
Implementing Bi analysis in an organization can be a complex process, but it can also provide significant benefits. Here is a step-by-step guide to implementing Bi analysis in your organization:
Step 1: Define Your Goals
The first step in implementing Bi analysis is to define your goals. What do you hope to achieve with Bi analysis? Do you want to improve performance, make informed decisions, or gain a competitive advantage? Once you have defined your goals, you can begin to identify the data sources and Bi analysis tools you need to achieve them.
Step 2: Identify Your Data Sources
The next step is to identify your data sources. Where does your data come from? Do you have data silos that need to be integrated? Identifying your data sources is essential for ensuring that you have the data you need to perform Bi analysis. It can also help you to identify any data quality issues that need to be addressed.
Step 3: Select Your Bi Analysis Tools
Once you have identified your data sources, you can begin to select your Bi analysis tools. Consider factors such as data integration, scalability, ease of use, and cost. You may also want to consider factors such as the tool’s reporting and visualization capabilities, as well as its ability to handle large volumes of data.
Step 4: Clean and Prepare Your Data
Before you can perform Bi analysis, you need to clean and prepare your data. This involves removing any duplicates, correcting any errors, and transforming your data into a format that can be analyzed. Data cleaning and preparation can be time-consuming, but it is essential for ensuring that your Bi analysis is accurate and reliable.
Step 5: Train Your Staff
Finally, you need to train your staff on how to use your Bi analysis tools. This involves providing training on how to access and analyze data, as well as how to create reports and visualizations. Training your staff can help to ensure that they are able to use your Bi analysis tools effectively and efficiently.
Implementing Bi analysis in your organization can provide significant benefits, but it is not without its challenges. Common challenges include data silos, data privacy, and skill gaps. However, by following these steps and addressing these challenges, you can successfully implement Bi analysis in your organization and start making informed decisions based on data.
Best Practices for Bi Analysis
Bi analysis can provide significant benefits for organizations, but it’s important to follow best practices to ensure that you’re getting the most out of your Bi analysis efforts. Here are some tips and best practices for getting the most out of your Bi analysis:
Focus on the Right Metrics
When it comes to Bi analysis, it’s important to focus on the right metrics. This means identifying the key performance indicators (KPIs) that are most relevant to your organization’s goals and objectives. By focusing on the right metrics, you can ensure that you’re measuring what matters and making data-driven decisions that are aligned with your organization’s strategic objectives.
Ensure Data Quality
Data quality is essential for accurate and reliable Bi analysis. This means ensuring that your data is complete, accurate, and up-to-date. It’s important to establish data quality standards and processes to ensure that your data is reliable and trustworthy. This can include data cleansing, data validation, and data governance processes.
Communicate Your Findings Effectively
Effective communication is essential for getting the most out of your Bi analysis. This means presenting your findings in a clear and concise way that is easy for stakeholders to understand. It’s important to use visualizations, charts, and graphs to help communicate your findings and make them more engaging and easy to digest.
Continuously Monitor and Refine Your Bi Analysis
Bi analysis is not a one-time activity, but rather an ongoing process. This means continuously monitoring your Bi analysis and refining it as needed. It’s important to establish processes for ongoing data collection, analysis, and reporting to ensure that your Bi analysis remains relevant and up-to-date.
Invest in Training and Development
Finally, it’s important to invest in training and development for your Bi analysis team. This can include training on specific Bi analysis tools and technologies, as well as best practices for data analysis and visualization. By investing in training and development, you can ensure that your team has the skills and knowledge needed to succeed with Bi analysis.
By following these best practices, organizations can ensure that they’re getting the most out of their Bi analysis efforts and making data-driven decisions that are aligned with their strategic objectives. It’s important to remember that Bi analysis is an ongoing process, and it’s essential to continuously monitor and refine your Bi analysis to ensure that it remains relevant and up-to-date.

How to Overcome Bi Analysis Challenges
While Bi analysis can provide significant benefits for organizations, it’s not without its challenges. Here are some of the common challenges organizations face when implementing Bi analysis, along with some solutions and workarounds:
Data Silos
Data silos can be a major challenge for organizations implementing Bi analysis. This occurs when data is stored in separate departments or systems, making it difficult to access and analyze. To overcome this challenge, organizations can implement data integration tools and processes to bring together data from different sources. This can include data warehousing, data lakes, and data virtualization technologies.
Data Privacy
Data privacy is another major challenge for organizations implementing Bi analysis. With the increasing amount of data being collected and analyzed, it’s important to ensure that sensitive data is protected. To overcome this challenge, organizations can implement data privacy policies and procedures, as well as data encryption and access controls. It’s also important to ensure that data is collected and used in compliance with relevant data privacy regulations, such as GDPR and CCPA.
Skill Gaps
Skill gaps can also be a challenge for organizations implementing Bi analysis. This occurs when staff lack the necessary skills and knowledge to effectively use Bi analysis tools and technologies. To overcome this challenge, organizations can invest in training and development programs for their staff. This can include training on specific Bi analysis tools and technologies, as well as best practices for data analysis and visualization.
Cost
Cost can also be a challenge for organizations implementing Bi analysis. Bi analysis tools and technologies can be expensive, and it’s important to ensure that the benefits of Bi analysis outweigh the costs. To overcome this challenge, organizations can conduct a cost-benefit analysis to determine the ROI of Bi analysis. They can also look for cost-effective Bi analysis solutions, such as open-source tools and cloud-based services.
By understanding and addressing these common challenges, organizations can successfully implement Bi analysis and start making data-driven decisions that improve performance and gain a competitive advantage. It’s important to remember that Bi analysis is an ongoing process, and it’s essential to continuously monitor and refine your Bi analysis to ensure that it remains relevant and up-to-date.
The Future of Bi Analysis: Artificial Intelligence, Machine Learning, and Natural Language Processing
Bi analysis is an ever-evolving field, and new trends and developments are constantly emerging. One of the most exciting and innovative areas of Bi analysis is the use of artificial intelligence (AI), machine learning (ML), and natural language processing (NLP). Here’s a closer look at how these technologies are impacting the field of Bi analysis and what organizations can expect in the coming years:
Artificial Intelligence
Artificial intelligence is a branch of computer science that focuses on creating intelligent machines that can perform tasks that typically require human intelligence, such as visual perception, speech recognition, and decision-making. In the context of Bi analysis, AI is being used to automate data analysis and provide more accurate and insightful insights.
One example of AI in Bi analysis is the use of machine learning algorithms to analyze large datasets and identify patterns and trends. This can help organizations make more informed decisions and gain a competitive advantage. AI is also being used to automate data cleaning and preparation, which can save time and reduce errors.
Machine Learning
Machine learning is a subset of AI that involves training machines to learn from data. In the context of Bi analysis, machine learning is being used to analyze large datasets and identify patterns and trends. This can help organizations make more informed decisions and gain a competitive advantage.
One example of machine learning in Bi analysis is the use of predictive analytics to forecast future trends and behaviors. This can help organizations anticipate customer needs, optimize supply chain operations, and identify potential risks and opportunities.
Natural Language Processing
Natural language processing is a branch of AI that focuses on the interaction between computers and human language. In the context of Bi analysis, NLP is being used to analyze text data and extract insights. This can help organizations understand customer sentiment, monitor brand reputation, and identify potential risks and opportunities.
One example of NLP in Bi analysis is the use of sentiment analysis to analyze social media posts and identify customer sentiment. This can help organizations understand how customers feel about their products or services and make data-driven decisions to improve customer satisfaction and loyalty.
In conclusion, the future of Bi analysis is bright, with artificial intelligence, machine learning, and natural language processing poised to revolutionize the field. By leveraging these technologies, organizations can gain deeper insights into their data, make more informed decisions, and gain a competitive advantage. It’s an exciting time to be in the world of Bi analysis, and we can’t wait to see what the future holds.