
What is Azure Analytics?
Azure Analytics is a suite of cloud-based data processing, analysis, and visualization services offered by Microsoft. It enables organizations to collect, store, and analyze large volumes of structured and unstructured data from various sources, including applications, devices, and sensors. By leveraging Azure Analytics, businesses can derive valuable insights from their data, make informed decisions, and drive innovation.
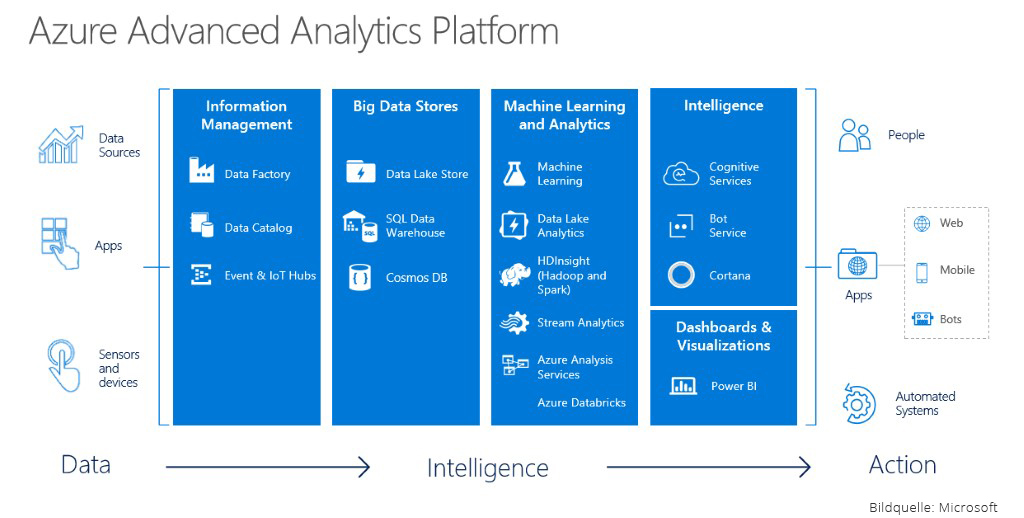
The main components and services of Azure Analytics include:
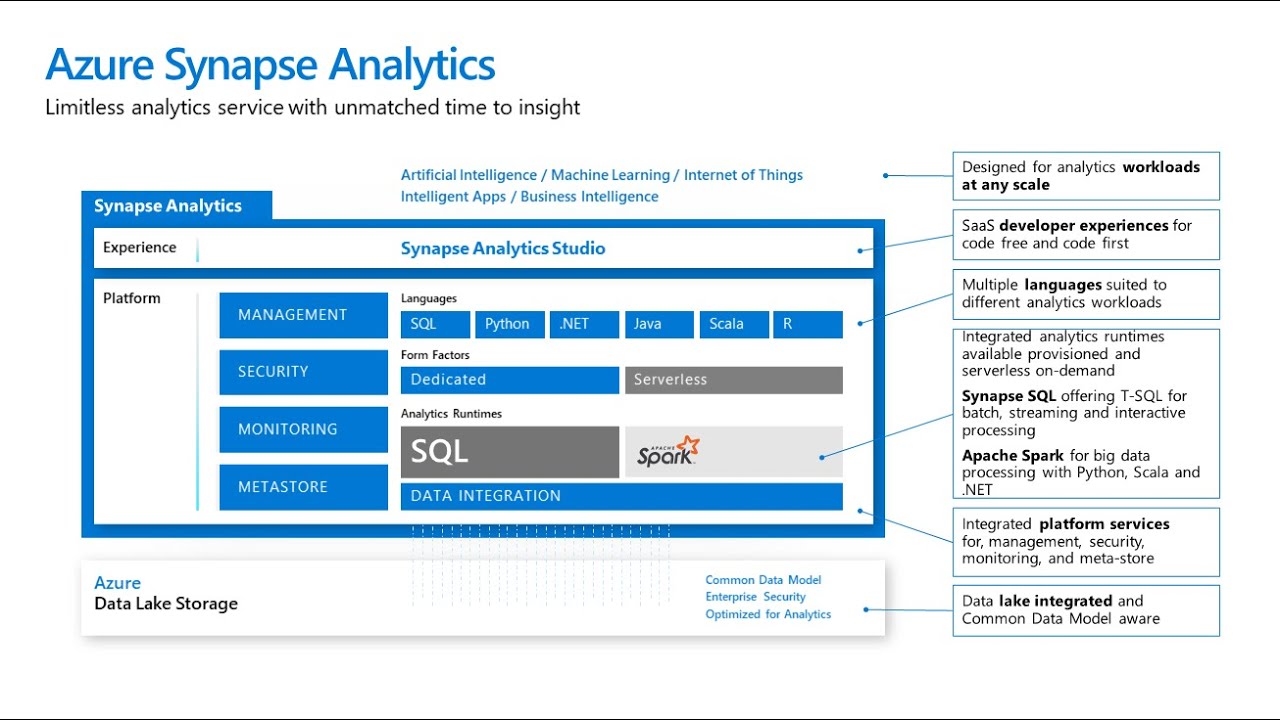
- Azure Synapse Analytics: A limitless analytics service that brings together data integration, enterprise data warehousing, and big data analytics.
- Azure Data Lake Storage: A secure, scalable, and cost-effective data lake that allows for the storage and analysis of large datasets.
- Azure Stream Analytics: A real-time analytics service that enables the processing and analysis of streaming data from various sources, such as IoT devices and applications.
- Azure Machine Learning: A cloud-based predictive analytics service that allows data scientists and developers to build, train, and deploy machine learning models.
- Azure Cognitive Services: A collection of pre-built artificial intelligence (AI) services that can be easily integrated into applications and workflows to enhance decision-making and user experiences.
Why Choose Azure Analytics?
Azure Analytics offers numerous advantages for organizations seeking to harness the power of their data. Its cloud-based infrastructure provides scalability, enabling businesses to handle increasing data volumes and user demands with ease. Additionally, Azure Analytics offers robust security features, ensuring that sensitive data remains protected throughout the entire data lifecycle.
One of the key benefits of Azure Analytics is its seamless integration with other Microsoft services, such as Office 365, Dynamics 365, and Power BI. This integration allows for a unified analytics experience, enabling users to access, analyze, and visualize data from multiple sources within a single platform. As a result, businesses can derive deeper insights, make informed decisions, and drive innovation more effectively.
Real-world use cases and industry examples demonstrate the value of Azure Analytics. For instance, a manufacturing company can leverage Azure Analytics to monitor and analyze production data, identify bottlenecks, and optimize supply chain management. Similarly, a retail business can utilize Azure Analytics to analyze customer behavior, preferences, and purchasing patterns, ultimately enhancing the overall customer experience and driving sales growth.
In summary, Azure Analytics offers a powerful, flexible, and secure analytics platform that can help organizations of all sizes and industries unlock the potential of their data. Its ability to scale, integrate with other Microsoft services, and provide valuable insights makes it an ideal choice for businesses seeking to drive data-driven decision-making and innovation.
Azure Analytics Services Overview
Azure Analytics offers a wide range of services designed to help organizations process, analyze, and visualize their data effectively. These services include:
- Azure Synapse Analytics: A limitless analytics service that combines data integration, enterprise data warehousing, and big data analytics. Azure Synapse Analytics enables businesses to analyze data quickly and efficiently, using a serverless, on-demand approach. It supports various data types and sources, including SQL, NoSQL, and Spark.
- Azure Data Lake Storage: A secure, scalable, and cost-effective data lake that allows for the storage and analysis of large datasets. Azure Data Lake Storage offers a single storage solution for both structured and unstructured data, enabling businesses to access, analyze, and share data across various platforms and services.
- Azure Stream Analytics: A real-time analytics service that processes and analyzes streaming data from various sources, such as IoT devices and applications. Azure Stream Analytics enables businesses to react to real-time data, trigger alerts, and make data-driven decisions in near real-time.
- Azure Machine Learning: A cloud-based predictive analytics service that allows data scientists and developers to build, train, and deploy machine learning models. Azure Machine Learning offers a user-friendly interface, pre-built algorithms, and automated machine learning capabilities, enabling businesses to create custom models without requiring extensive machine learning expertise.
- Azure Cognitive Services: A collection of pre-built artificial intelligence (AI) services that can be easily integrated into applications and workflows to enhance decision-making and user experiences. Azure Cognitive Services offers a wide range of capabilities, including computer vision, natural language processing, and speech recognition.
By leveraging these services, businesses can build a comprehensive Azure Analytics solution tailored to their unique needs and requirements. The flexibility, scalability, and security offered by Azure Analytics make it an ideal choice for organizations seeking to unlock the potential of their data and drive data-driven decision-making.
How to Get Started with Azure Analytics
Getting started with Azure Analytics involves several steps, including setting up an account, configuring services, and creating a data pipeline. Here’s a step-by-step guide to help you get started:
Step 1: Set up an Azure Account
To use Azure Analytics, you need to have an Azure account. If you don’t have one, you can sign up for a free trial on the Azure website. Once you have an account, log in to the Azure portal.
Step 2: Create an Azure Synapse Analytics Workspace
Azure Synapse Analytics is the primary service for data processing and analysis in Azure Analytics. To create a workspace, click on the “Create a resource” button in the Azure portal, search for “Azure Synapse Analytics,” and follow the on-screen instructions. Make sure to select a subscription, resource group, and region for your workspace.
Step 3: Configure Azure Data Lake Storage
Azure Data Lake Storage is a secure and scalable storage solution for your data. To configure it, navigate to the “Data” section of your Azure Synapse Analytics workspace and click on “Linked services.” From there, click on “New,” search for “Azure Data Lake Storage,” and follow the on-screen instructions to link your storage account.
Step 4: Create a Data Pipeline
A data pipeline is a series of activities that move and transform data from one place to another. To create a pipeline, navigate to the “Integrate” section of your Azure Synapse Analytics workspace and click on “Pipelines.” From there, click on “New” and use the visual editor to create a pipeline that moves data from your data lake to a data warehouse or data mart.
Step 5: Visualize Your Data
Once your data is in a data warehouse or data mart, you can use tools like Power BI to visualize your data. To connect Power BI to your Azure Synapse Analytics workspace, navigate to the “Monitor” section and click on “Power BI.” From there, follow the on-screen instructions to connect your workspace to Power BI.
By following these steps, you can set up an Azure Analytics account, configure services, and create a data pipeline. Once you have your data pipeline in place, you can start analyzing and visualizing your data to gain valuable insights and make data-driven decisions.
Building an Azure Analytics Solution: A Practical Example
In this section, we will walk through a real-world example of building an Azure Analytics solution, focusing on analyzing customer behavior for an e-commerce website. Let’s assume that our e-commerce website generates a large volume of data daily, including user activity, product information, and transaction data. We want to use Azure Analytics to analyze this data and gain insights into customer behavior, such as:
- Identifying popular products and categories
- Understanding customer browsing patterns
- Analyzing customer purchase history
- Predicting customer churn and cross-selling opportunities
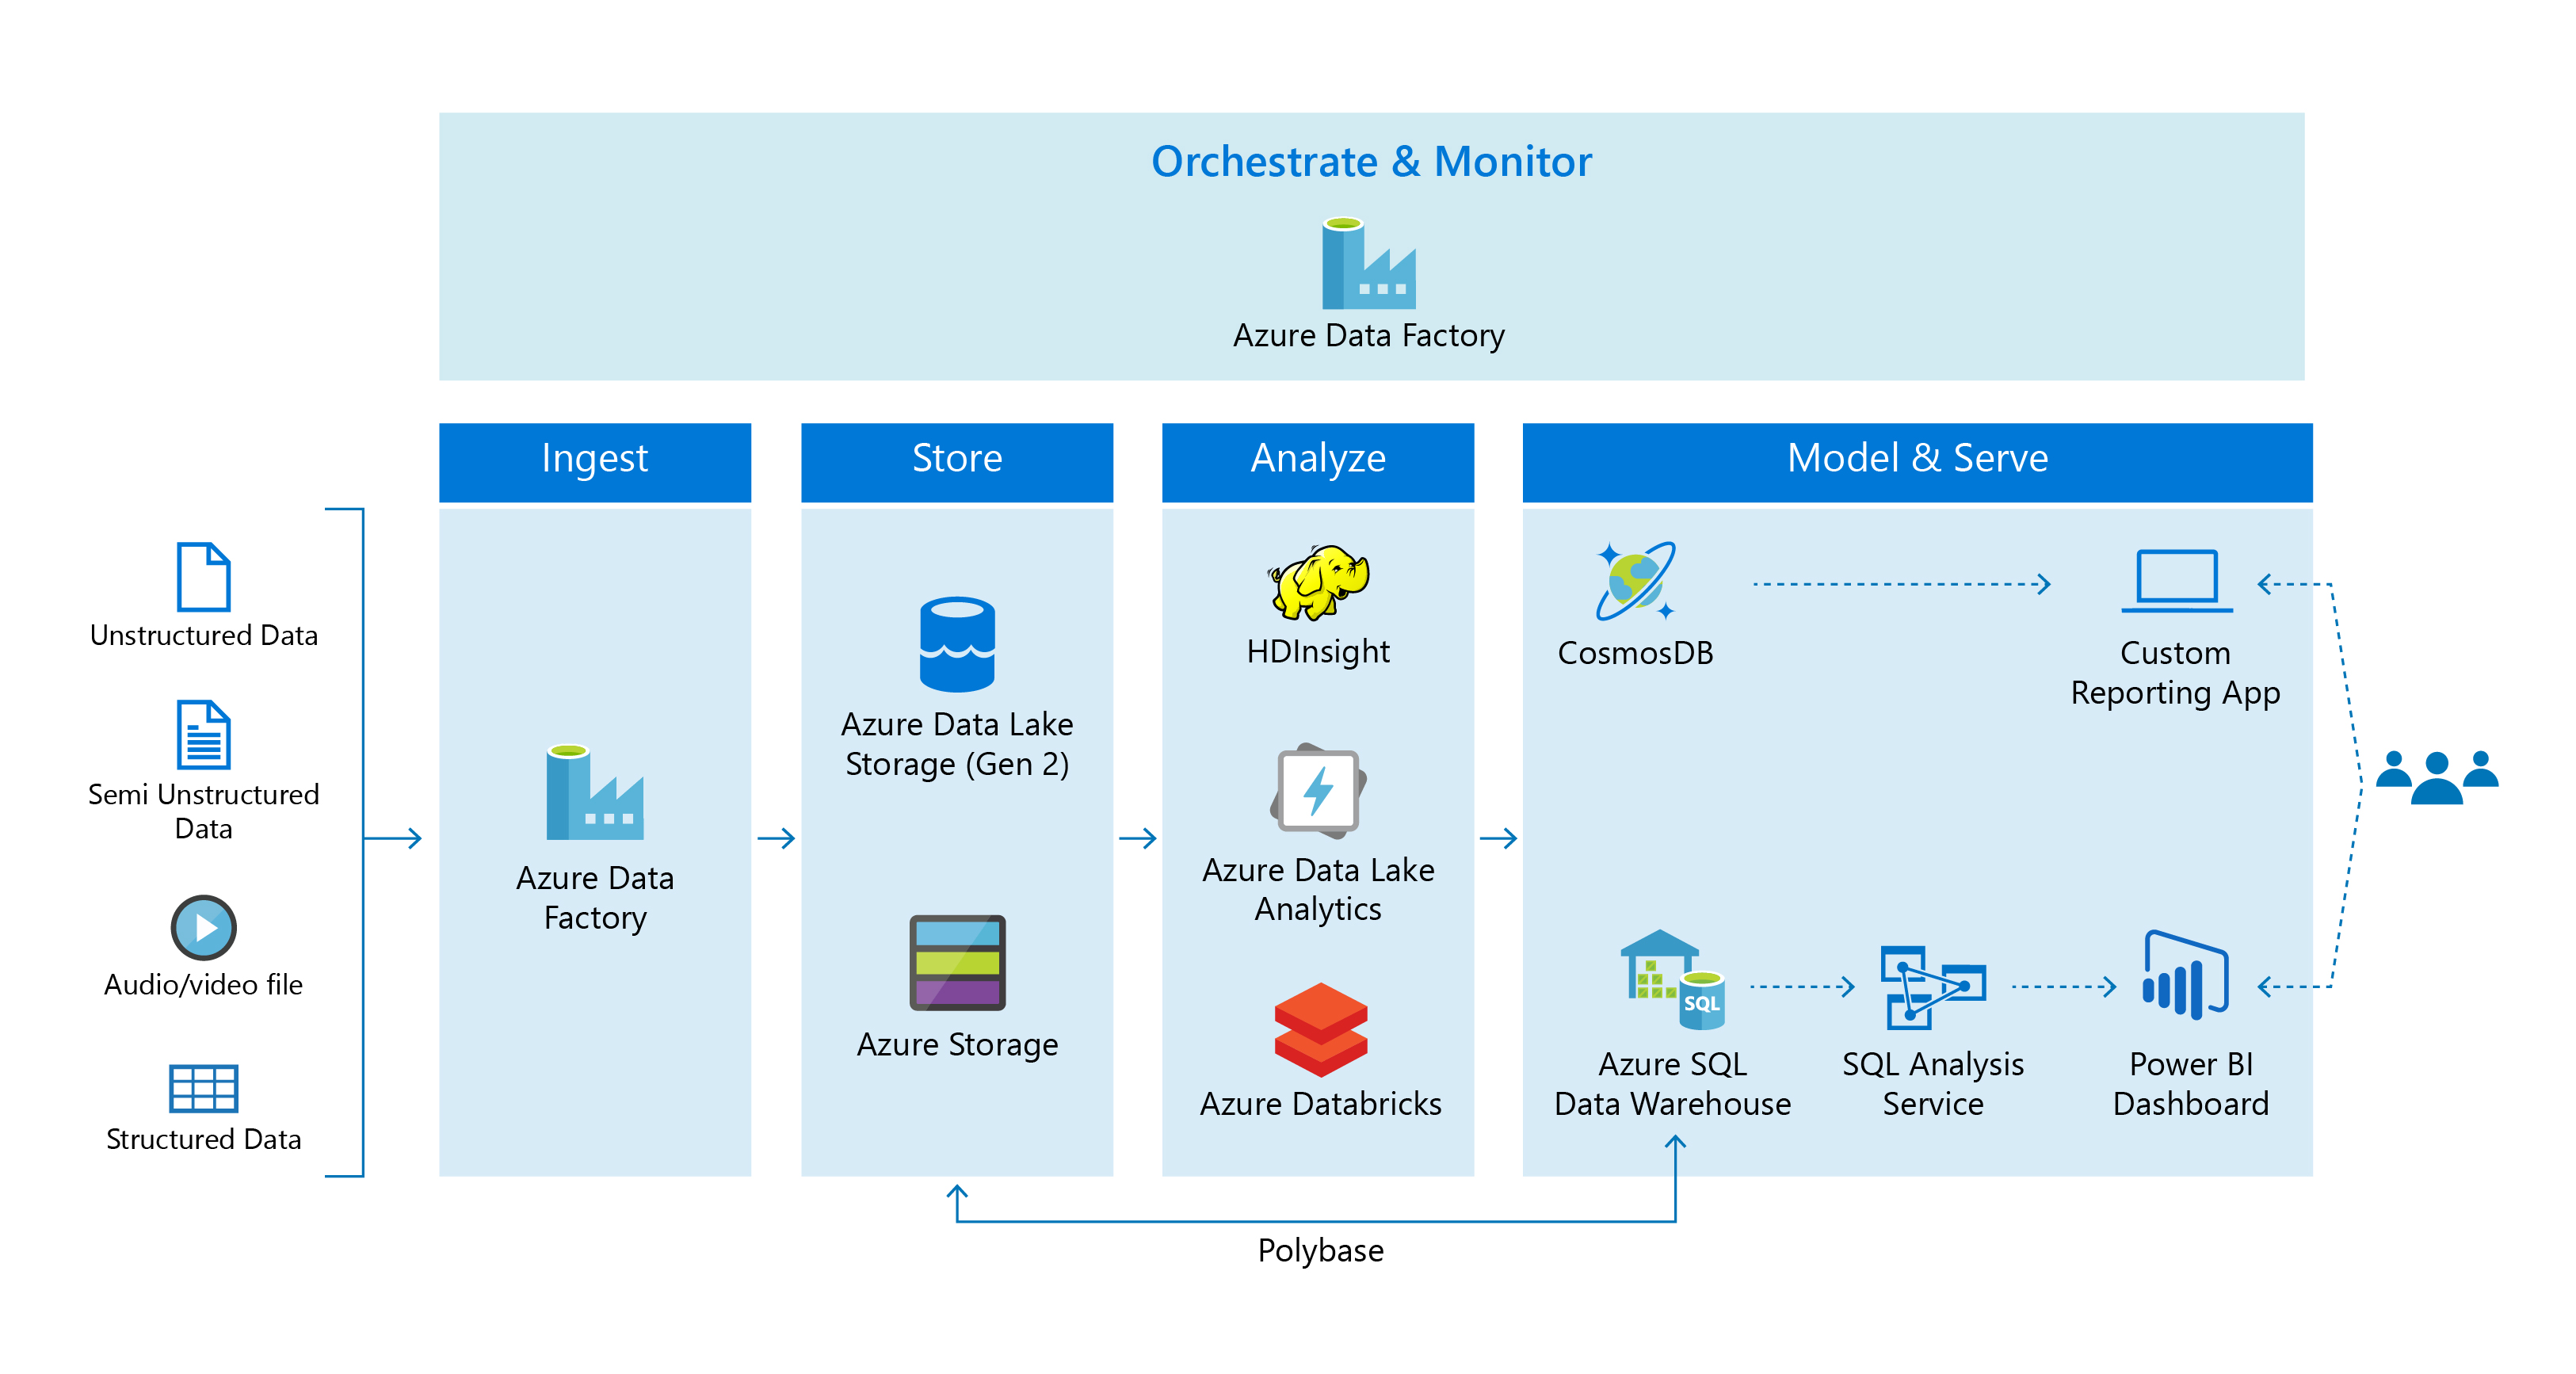
Step 1: Data Ingestion
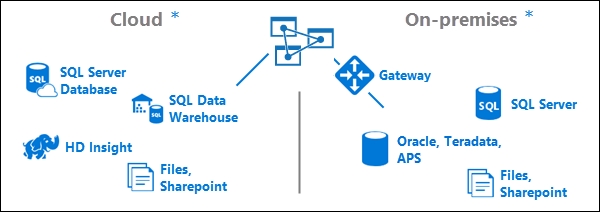
The first step is to ingest the data from the e-commerce website into Azure. We can use Azure Data Factory (ADF) to create a data pipeline that moves data from the website’s database to Azure Data Lake Storage. ADF supports various data sources, including SQL databases, NoSQL databases, and cloud storage services. Once the data is in Azure Data Lake Storage, we can use Azure Data Bricks or Azure Databricks to process and transform the data.
Step 2: Data Processing
After ingesting the data, we need to process and transform it to make it suitable for analysis. We can use Azure Databricks, a managed Apache Spark service, to process and transform the data. Databricks supports various data processing tasks, including data cleaning, data transformation, and feature engineering. Once the data is processed, we can store it in Azure Data Lake Storage or Azure SQL Database for further analysis.
Step 3: Data Analysis
Once the data is processed, we can use Azure Synapse Analytics to analyze it and gain insights into customer behavior. Azure Synapse Analytics is a cloud-native analytics service that combines data integration, data warehousing, and big data analytics. We can use SQL, Python, or R to analyze the data and create reports and dashboards. We can also use Azure Machine Learning to create predictive models and machine learning algorithms to gain deeper insights into customer behavior.
Step 4: Data Visualization
Finally, we can use Power BI to visualize the data and create interactive reports and dashboards. Power BI is a cloud-based business analytics service that supports various data sources, including Azure Synapse Analytics, Azure SQL Database, and Azure Data Lake Storage. We can use Power BI to create custom visualizations, such as charts, graphs, and maps, to gain insights into customer behavior. We can also use Power BI to share the reports and dashboards with other team members and stakeholders.
By following these steps, we can build a comprehensive Azure Analytics solution that analyzes customer behavior for an e-commerce website. Azure Analytics provides various services and tools that enable us to ingest, process, analyze, and visualize data, making it an ideal choice for businesses seeking to gain insights into their data.
Optimizing Azure Analytics Performance
Azure Analytics offers a wide range of services and tools for processing, analyzing, and visualizing data. To ensure optimal performance, it’s essential to follow best practices for data partitioning, indexing, and caching. In this section, we’ll discuss these best practices and provide tips for monitoring and troubleshooting performance issues.
Data Partitioning
Data partitioning is the process of dividing large datasets into smaller, more manageable pieces. Partitioning can help improve query performance, reduce data storage costs, and simplify data management tasks. Azure Synapse Analytics, for example, supports data partitioning using horizontal partitioning, vertical partitioning, or hybrid partitioning. By partitioning data based on frequently used filters, such as date or geographical region, you can significantly improve query performance and reduce query execution time.
Indexing
Indexing is the process of creating metadata structures that enable faster data retrieval. Azure Synapse Analytics supports various indexing strategies, including clustered indexes, non-clustered indexes, and columnstore indexes. By creating indexes on frequently used columns, you can improve query performance and reduce query execution time. However, it’s essential to balance the benefits of indexing with the added storage and maintenance costs.
Caching
Caching is the process of storing frequently accessed data in memory to reduce data retrieval time. Azure Synapse Analytics supports caching using in-memory columnstore technology, which can significantly improve query performance for large datasets. By caching frequently accessed data, you can reduce query execution time and improve overall system performance.
Monitoring and Troubleshooting Performance Issues
Monitoring and troubleshooting performance issues is an essential part of optimizing Azure Analytics performance. Azure Synapse Analytics provides various monitoring and troubleshooting tools, including query performance insights, execution plans, and resource utilization metrics. By analyzing these metrics, you can identify performance bottlenecks, such as slow queries, resource contention, or network latency. You can then take corrective action, such as optimizing queries, adding indexes, or scaling up resources, to improve system performance.
In conclusion, optimizing Azure Analytics performance requires a holistic approach that includes data partitioning, indexing, and caching. By following best practices and using monitoring and troubleshooting tools, you can ensure optimal performance and maximize the value of your Azure Analytics investment.
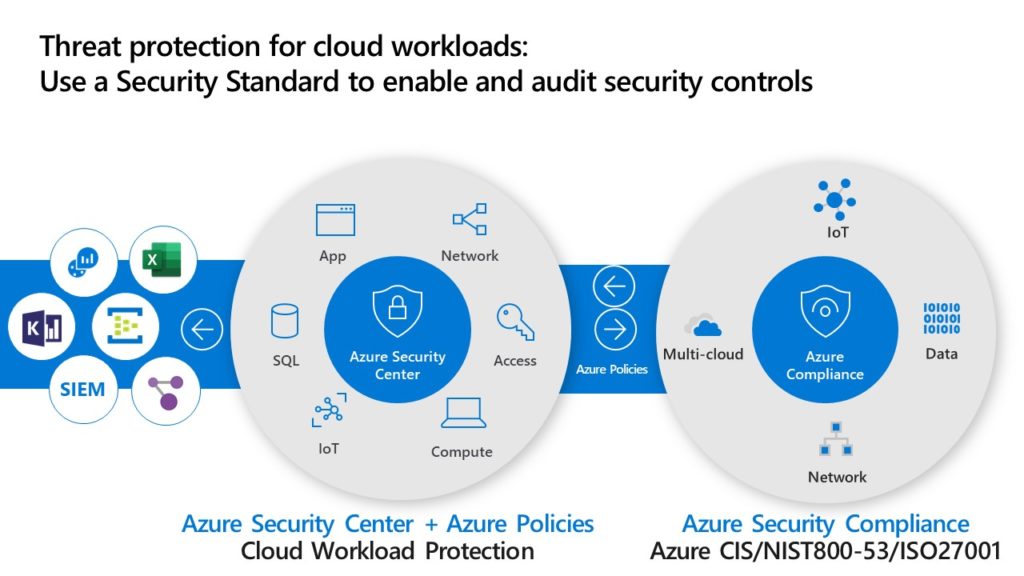
Azure Analytics Security and Compliance
Azure Analytics offers robust security and compliance features to ensure the confidentiality, integrity, and availability of your data. In this section, we’ll discuss the key security and compliance features of Azure Analytics and provide examples of relevant certifications and regulations.
Data Encryption
Azure Analytics supports data encryption at rest and in transit using various encryption algorithms, such as Advanced Encryption Standard (AES) and Transport Layer Security (TLS). Data encryption ensures that your data is protected from unauthorized access, theft, and tampering. Azure Synapse Analytics, for example, supports data encryption using service-managed keys, customer-managed keys, or customer-provided keys.
Access Control
Azure Analytics supports access control using various authentication and authorization mechanisms, such as Azure Active Directory (Azure AD), role-based access control (RBAC), and single sign-on (SSO). Access control ensures that only authorized users and applications can access your data and perform specific actions, such as reading, writing, or deleting data.
Auditing and Monitoring
Azure Analytics supports auditing and monitoring using various tools, such as Azure Monitor, Azure Log Analytics, and Azure Security Center. Auditing and monitoring enable you to track user activity, detect anomalies, and investigate security incidents. Azure Synapse Analytics, for example, supports auditing and monitoring using Azure Monitor, which provides detailed insights into query performance, resource utilization, and security events.
Certifications and Regulations
Azure Analytics complies with various industry standards and regulations, such as General Data Protection Regulation (GDPR), Health Insurance Portability and Accountability Act (HIPAA), and International Organization for Standardization (ISO) 27001. By adhering to these standards and regulations, Azure Analytics ensures that your data is protected and managed in compliance with legal and regulatory requirements.
In conclusion, Azure Analytics offers robust security and compliance features to ensure the confidentiality, integrity, and availability of your data. By using data encryption, access control, auditing, and monitoring, you can protect your data from unauthorized access, tampering, and theft. Additionally, Azure Analytics complies with various industry standards and regulations, such as GDPR, HIPAA, and ISO 27001, to ensure that your data is managed in compliance with legal and regulatory requirements.
Integrating Azure Analytics with Other Tools and Services
Azure Analytics offers seamless integration with various tools and services, enabling you to extend the functionality of your analytics solution and improve productivity. In this section, we’ll discuss the integration capabilities of Azure Analytics with Power BI, Azure DevOps, and third-party applications.
Power BI
Power BI is a business analytics service that provides interactive visualizations and business intelligence capabilities. Azure Analytics integrates with Power BI, enabling you to create custom dashboards and reports using data from Azure Analytics services. By using Power BI with Azure Analytics, you can gain deeper insights into your data, create interactive visualizations, and share insights with your team.
Azure DevOps
Azure DevOps is a set of development tools that provides version control, continuous integration, and continuous delivery capabilities. Azure Analytics integrates with Azure DevOps, enabling you to track the performance and usage of your applications in real-time. By using Azure DevOps with Azure Analytics, you can improve the reliability and performance of your applications, reduce downtime, and accelerate the development lifecycle.
Third-Party Applications
Azure Analytics also integrates with various third-party applications, such as Salesforce, Marketo, and Google Analytics. By integrating Azure Analytics with these applications, you can gain a unified view of your data, improve data accuracy, and reduce manual data entry. For example, you can use Azure Data Factory to extract data from Salesforce, transform the data using Azure Databricks, and load the data into Azure Synapse Analytics for analysis.
In conclusion, Azure Analytics offers seamless integration with various tools and services, enabling you to extend the functionality of your analytics solution and improve productivity. By integrating Azure Analytics with Power BI, Azure DevOps, and third-party applications, you can gain deeper insights into your data, improve the reliability and performance of your applications, and reduce manual data entry.
