
What is AWS Analytics?
AWS Analytics is a powerful suite of data processing, analysis, and visualization tools provided by Amazon Web Services (AWS). It offers a wide range of services designed to help organizations extract valuable insights from their data, enabling them to make informed decisions and drive business growth. The AWS Analytics portfolio includes Amazon Redshift, Amazon Kinesis, Amazon QuickSight, AWS Glue, and many other services.

Why Choose AWS Analytics?
AWS Analytics offers numerous benefits for organizations looking to harness the power of their data. Its primary advantages include:
- Scalability: AWS Analytics services can easily scale to accommodate growing data needs, allowing organizations to process and analyze vast amounts of data without worrying about infrastructure limitations.
- Cost-effectiveness: With AWS Analytics, organizations only pay for the resources they use, reducing the overall cost of data processing and analysis. Additionally, AWS offers various pricing models, including on-demand, reserved, and spot instances, enabling organizations to optimize their spending.
- Ease of integration: AWS Analytics services can be seamlessly integrated with other AWS offerings, allowing organizations to create end-to-end data workflows that encompass storage, processing, analysis, and visualization.
- Real-life use cases: AWS Analytics has been instrumental in driving business value across various industries. For instance, in the retail sector, AWS Analytics helps businesses analyze customer purchasing patterns, enabling them to optimize inventory management and personalize marketing campaigns. In healthcare, AWS Analytics facilitates the analysis of large-scale genomic data, accelerating research and improving patient outcomes.
Key Components of AWS Analytics
AWS Analytics comprises several powerful services that cater to various data processing, analysis, and visualization needs. Here are some of the primary components:
- Amazon Redshift: A fast, fully managed data warehouse that makes it simple and cost-effective to analyze all your data using standard SQL and your existing business intelligence tools.
- Amazon Kinesis: A platform for processing real-time streaming data, enabling organizations to ingest, analyze, and store terabytes of data per hour in real-time.
- Amazon QuickSight: A fast, cloud-powered business intelligence service that makes it easy to deliver insights to everyone in your organization.
- AWS Glue: A fully managed extract, transform, and load (ETL) service that makes it easy to prepare and load data for analytics.
These services can be used individually or combined to create end-to-end data workflows, providing organizations with the flexibility to address their unique data processing and analysis requirements.

Getting Started with AWS Analytics
To begin your journey with AWS Analytics, follow these steps:
- Create an AWS account: If you don’t already have one, sign up for an AWS account at href=”https://aws.amazon.com/” target=”_blank” rel=”noopener noreferrer”>https://aws.amazon.com/. AWS offers a Free Tier for 12 months, which allows you to explore and experiment with many of its services.
- Identify your needs: Determine the specific data processing, analysis, and visualization requirements for your organization. This will help you select the most appropriate AWS Analytics services.
- Choose the right services: Based on your needs, select the relevant AWS Analytics services from the suite of offerings. For instance, you might opt for Amazon Redshift for data warehousing, Amazon Kinesis for real-time data processing, and Amazon QuickSight for data visualization.
- Configure settings: Carefully configure the settings for each selected service, ensuring they are optimized for your specific use case. This may involve setting up data sources, defining data schemas, and configuring access controls.
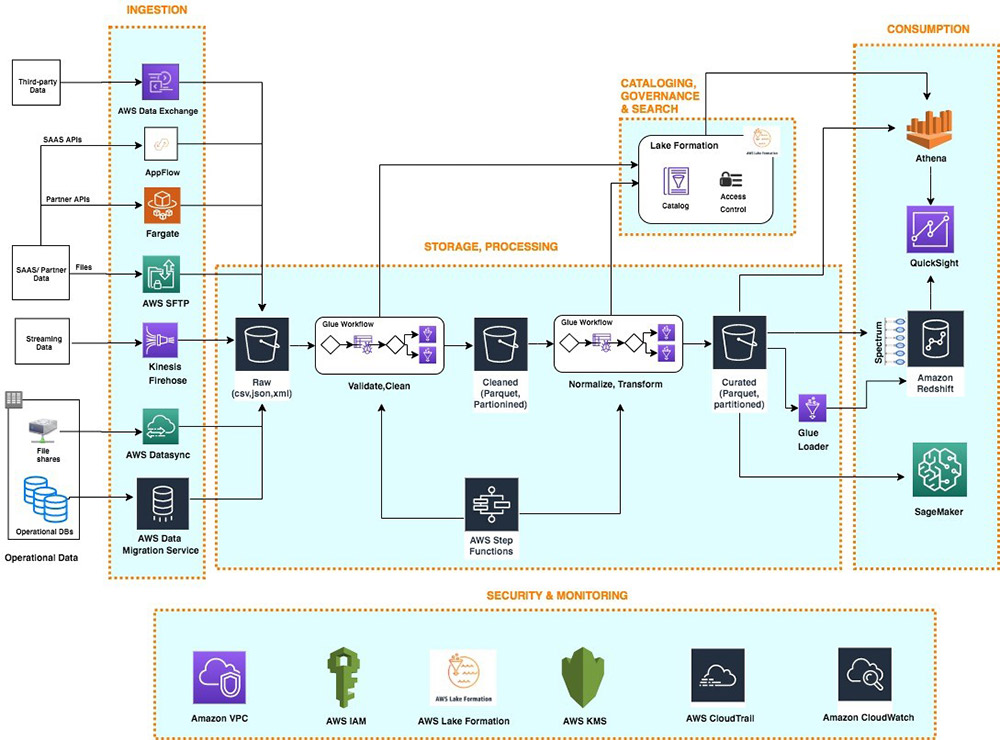
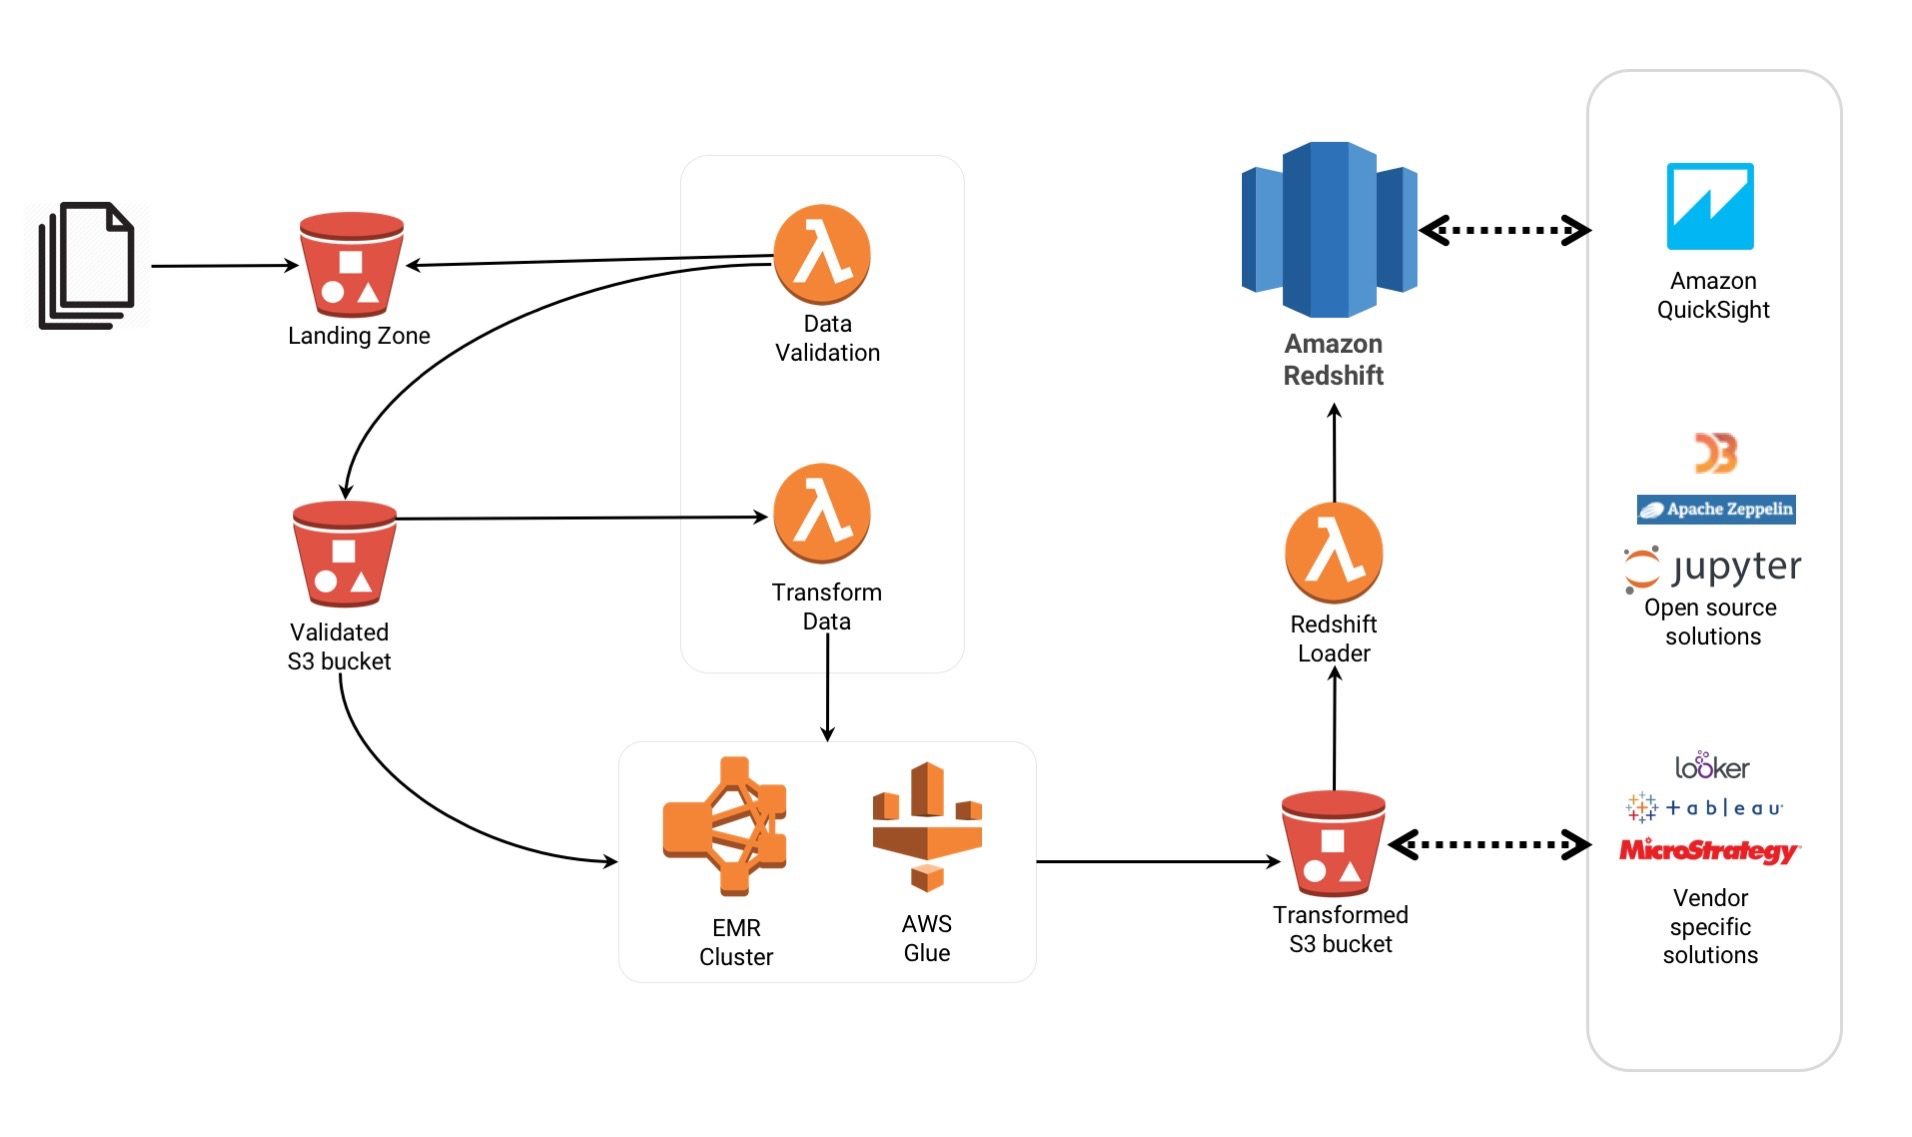
- Integrate with other AWS services: Leverage the ease of integration offered by AWS Analytics services to create end-to-end data workflows. For example, you might use AWS Glue to extract data from various sources, process it using Amazon EMR, and then load it into Amazon Redshift for analysis.

How to Migrate Data to AWS Analytics
Migrating data to AWS Analytics can be accomplished using various tools and techniques. Here are some methods to consider:
- AWS Data Pipeline: A fully managed data workflow service that enables you to move and process data between different AWS data stores. With AWS Data Pipeline, you can create, schedule, and manage data workflows, making it easier to migrate data to AWS Analytics services.
- AWS Glue: A fully managed ETL service that makes it easy to move data between data stores. AWS Glue can extract data from various sources, transform it to fit your data model, and load it into AWS Analytics services. This service is particularly useful when dealing with large-scale, complex data migration projects.
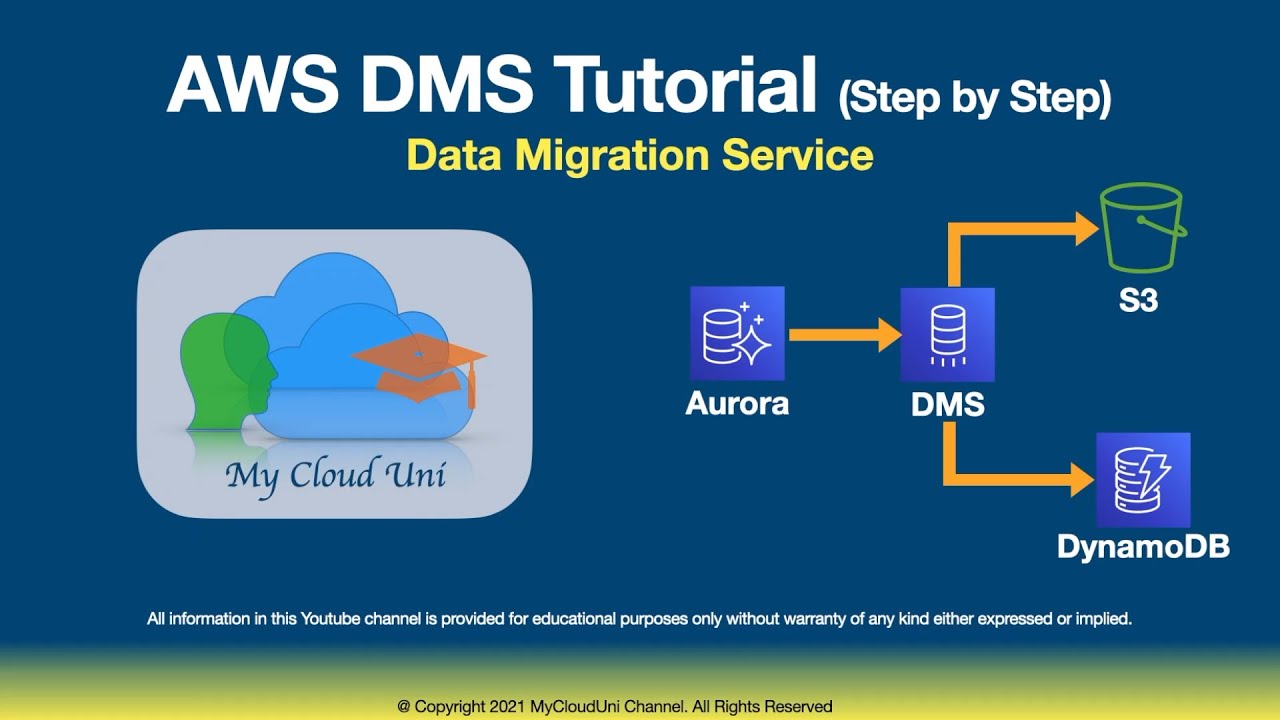
- AWS Database Migration Service (DMS): A service that helps you migrate databases to AWS easily and securely. With DMS, you can migrate your data to Amazon Redshift, Amazon DynamoDB, or any other AWS data store, ensuring minimal downtime and minimal impact on your existing workloads.
When migrating data to AWS Analytics, consider the following best practices:
- Plan your migration carefully, considering the volume, velocity, and variety of your data.
- Ensure data compatibility with your target AWS Analytics services.
- Monitor the migration process closely to identify and address any issues promptly.
- Test your migration thoroughly before switching to the new environment.
Data Processing and Analysis with AWS Analytics
AWS Analytics offers a variety of services to process and analyze data, catering to both real-time and batch processing needs. Here are some of the key services to consider:
- Amazon Kinesis: A platform for processing real-time streaming data, enabling organizations to ingest, analyze, and store terabytes of data per hour in real-time. Amazon Kinesis is ideal for use cases such as live leaderboards, social media trending topics, and IoT device telemetry.
- Amazon EMR: A managed big data platform that uses Apache Hadoop, Spark, and other open-source tools to process and analyze large datasets. With Amazon EMR, you can perform batch processing, machine learning, and graph processing, making it suitable for use cases such as log analysis, scientific research, and predictive analytics.
When processing and analyzing data with AWS Analytics, consider the following best practices:
- Optimize data processing by selecting the most appropriate service for your specific use case.
- Ensure data compatibility with your chosen AWS Analytics services.
- Monitor data processing and analysis tasks closely to identify and address any issues promptly.
- Test your data processing and analysis workflows thoroughly before deploying them in a production environment.
Visualizing Data with AWS Analytics
Transforming raw data into actionable insights is crucial for businesses to make informed decisions. Amazon QuickSight, a fully managed business intelligence service within AWS Analytics, enables users to create interactive and visually appealing dashboards. Here’s how to get started:
- Sign in to Amazon QuickSight: Access Amazon QuickSight through the AWS Management Console using your AWS account credentials.
- Create a dataset: Connect Amazon QuickSight to your data sources, such as Amazon Redshift, Amazon RDS, or S3. Define the schema and import the data into a dataset.
- Create a dashboard: Use the drag-and-drop interface to create visualizations, such as charts, tables, and pivot tables. Arrange these visualizations on the dashboard to provide a clear and concise view of your data.
- Share your dashboard: Publish your dashboard to make it accessible to other users within your organization. Set permissions to control who can view and interact with the dashboard.
When creating dashboards with Amazon QuickSight, consider the following best practices:
- Ensure data compatibility with Amazon QuickSight by verifying the data format and schema.
- Optimize visualizations for clarity and ease of understanding.
- Monitor dashboard performance and address any issues promptly.
- Test your dashboards thoroughly before sharing them with other users.
Best Practices for AWS Analytics
To maximize the value of AWS Analytics, consider the following best practices:
- Optimize query performance: Ensure that your queries are well-structured and take advantage of indexing, partitioning, and other performance optimization techniques. This will help you extract insights from your data more efficiently.
- Ensure data security: Implement appropriate security measures, such as encryption, access controls, and data masking, to protect your data. Regularly review and update your security policies to address new threats and vulnerabilities.
- Monitor costs: AWS Analytics services are billed based on usage, so it’s essential to monitor your costs and optimize your spending. Use AWS Cost Explorer to visualize your usage patterns and identify opportunities for cost savings.
- Implement data governance: Establish a data governance framework to ensure that your data is accurate, complete, and consistent. This will help you maintain the quality of your data and make more informed decisions.
- Continuously improve: Regularly review your AWS Analytics workflows and identify opportunities for improvement. This may include optimizing queries, refining visualizations, or implementing new services and features.
By following these best practices, you can ensure that your AWS Analytics environment is secure, efficient, and cost-effective. This will help you extract maximum value from your data and drive business growth.