Crafting Data Tables within Power BI Desktop
Power BI Desktop serves as the cornerstone for business intelligence and data modeling. It offers a robust environment for creating tables in Power BI and constructing comprehensive data models. The Power BI interface is designed to be intuitive, empowering users to connect to various data sources, transform data, and visualize insights effectively. Understanding the interface is crucial for creating tables in Power BI and leveraging its full potential.
Power BI Desktop provides a range of tools for creating tables in Power BI, from directly entering data to importing datasets from external sources. The platform’s capabilities extend to data transformation through the Power Query Editor, allowing for data cleansing and shaping. Furthermore, Power BI enables the definition of relationships between tables, which is fundamental for building a relational data model. This relational model is the backbone for creating tables in Power BI that support insightful analysis and reporting.
The process of creating tables in Power BI also encompasses advanced techniques like using DAX expressions to create calculated tables. These calculated tables provide flexibility in summarizing and manipulating data. Optimizing the data model is vital for performance, ensuring that reports load quickly and respond efficiently. By mastering the tools and techniques within Power BI Desktop, users can create robust and efficient data models that drive informed decision-making. The effectiveness of creating tables in Power BI directly impacts the quality and speed of data-driven insights.
How to Construct Tables Directly in Power BI
Power BI offers a direct method for creating tables in Power BI within the Desktop application, ideal for scenarios requiring manual data entry or the creation of small, static datasets. This is achieved through the “Enter Data” feature, a straightforward way to define tables without relying on external data sources. This method of creating tables in Power BI is particularly useful for creating lookup tables, dimension tables, or test datasets.
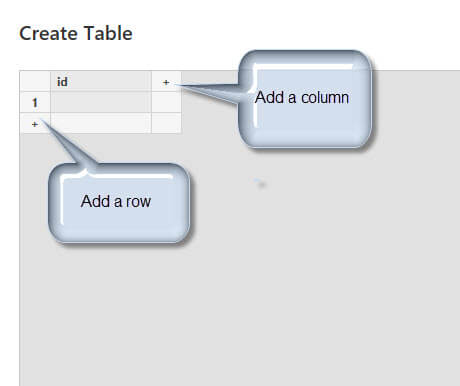
To begin creating tables in Power BI, locate the “Enter Data” option on the Home tab of the Power BI Desktop ribbon. Clicking this button opens a spreadsheet-like interface where you can define your table structure. Start by naming your table appropriately, reflecting the data it will contain. Next, define the column names for your table. Consider the data type each column will hold (text, number, date, etc.) as this will impact how Power BI processes and analyzes the data. Once the column structure is set, you can begin entering data row by row, similar to working in a spreadsheet program. For example, you might create a table called “ProductCategories” with columns such as “CategoryID” (Number) and “CategoryName” (Text). You would then manually enter the category IDs and names.
When creating tables in Power BI directly, it is important to ensure data consistency and accuracy. Double-check all entered values to avoid errors that could affect your analysis. Power BI automatically detects data types based on the initial entries, but you can manually adjust these in the Power Query Editor if needed. After entering all your data, click “Load” to import the table into your Power BI data model. From there, the new table can be used in visuals, calculations, and relationships with other tables in your model. While this method is suitable for small datasets, for larger or frequently updated data, importing from external sources is generally more efficient. However, for quick data entry and simple tables, the “Enter Data” feature provides a convenient way of creating tables in Power BI.
Leveraging External Data: Importing Datasets into Power BI
Power BI’s strength lies in its ability to connect to diverse data sources. This capability is fundamental to creating tables in Power BI that reflect a holistic view of your business. Importing datasets is a crucial step in the data modeling process. Power BI supports connections to a wide array of external sources. These include, but are not limited to, Excel workbooks, CSV files, SQL Server databases, Azure services, and various cloud platforms like Salesforce and Google Analytics. The process typically begins by selecting the “Get Data” option within the Power BI Desktop interface.
When importing data, users are presented with a list of available data connectors. Each connector is tailored to a specific data source, streamlining the connection process. For example, connecting to an Excel file requires specifying the file path and selecting the desired sheets or tables. Connecting to a SQL Server database involves providing server details, database name, and authentication credentials. Power BI offers options for both Import and DirectQuery connectivity modes. Import mode brings the data into Power BI’s memory, enabling fast performance and full DAX functionality. DirectQuery mode, on the other hand, queries the data source directly, ensuring that reports always reflect the latest data. Choosing the appropriate mode depends on factors such as data volume, refresh frequency requirements, and performance considerations. The process of creating tables in Power BI frequently involves importing data and requires an understanding of these connectivity modes.
Successfully importing data requires careful attention to data connection settings. Users may need to configure authentication methods, specify data refresh schedules, and address potential data type issues. Power BI automatically detects data types during import. However, it is essential to review these and make adjustments as needed. For instance, a column containing numerical data might be incorrectly interpreted as text. Addressing such data type mismatches early on prevents errors in subsequent data transformations and calculations. Furthermore, users should be aware of potential issues such as firewall restrictions, insufficient permissions, and data source limitations. Understanding these potential challenges and proactively addressing them ensures a smooth data import process and facilitates the effective creation of tables in Power BI. Properly imported and configured data is the foundation for building meaningful and accurate reports, truly showcasing the power of creating tables in Power BI.
Transforming Data with Power Query Editor: Shaping Tables for Analysis
The Power Query Editor is a vital tool for shaping data before loading it into tables when creating tables in Power BI. It enables users to clean, transform, and reshape imported data. This ensures that the data is accurate, consistent, and suitable for analysis. The Power Query Editor offers a wide array of functions to manipulate data effectively, improving the overall quality of your Power BI reports. With its intuitive interface, users can perform complex transformations without writing extensive code.
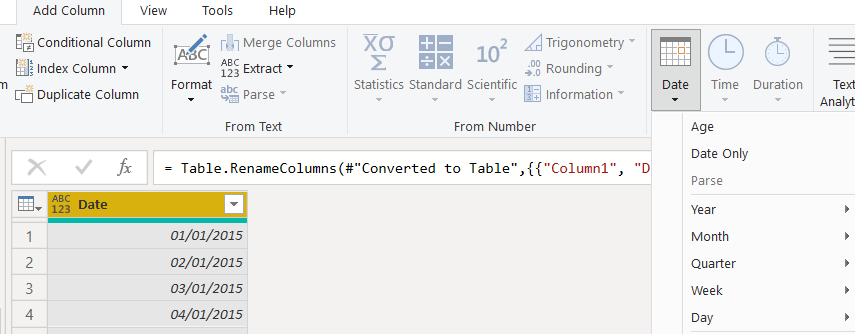
Several common transformations can be performed within the Power Query Editor to optimize data for creating tables in Power BI. Removing duplicates is a frequent task, ensuring that each record is unique. Splitting columns allows you to separate data contained within a single column into multiple columns, making it easier to analyze specific elements. For instance, a column containing full names can be split into separate columns for first and last names. Changing data types is also essential; Power BI needs to understand whether a column contains text, numbers, dates, or other data types to perform calculations and visualizations correctly. Dates might be imported as text and need to be converted to the date format. Numerical columns might need to be changed to the correct decimal or whole number type.
Beyond these basic functions, the Power Query Editor can handle more advanced transformations critical for creating tables in Power BI. Replacing values allows you to correct errors or standardize data entries. For example, if a company name is inconsistently entered (e.g., “Acme Corp,” “Acme Corporation”), you can replace all variations with a single standard name. Adding custom columns allows you to create new data based on existing columns using formulas and conditional logic. This is useful for creating calculated fields, such as profit margins or sales categories. Pivoting and unpivoting data reshapes the structure of your tables, making them more suitable for certain types of analysis. By mastering the Power Query Editor, users can ensure that their Power BI data models are clean, efficient, and tailored to their specific analytical needs, contributing significantly to effective creating tables in Power BI.
Defining Relationships Between Tables: Creating a Relational Model
Establishing relationships between tables is crucial for creating a robust and efficient data model within Power BI. This relational model allows Power BI to understand how different pieces of data connect, enabling accurate analysis and reporting. Without properly defined relationships, data analysis can become skewed and unreliable. Properly creating tables in power bi is key for accurate data modeling.
Power BI supports several types of relationships, each suited for different data structures. A one-to-many relationship is the most common, where one record in a table can relate to multiple records in another table. For example, one customer (in a ‘Customer’ table) can have multiple sales orders (in a ‘Sales’ table). A one-to-one relationship means that each record in one table corresponds to exactly one record in another. This is less common but can be useful for splitting a table for performance or security reasons. Many-to-many relationships occur when multiple records in one table can relate to multiple records in another. These relationships require a bridge or junction table to resolve the many-to-many cardinality, effectively creating two one-to-many relationships. Creating tables in power bi is fundamental to establishing these relationships.
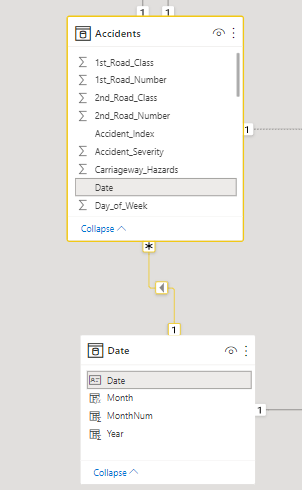
To define relationships in Power BI, navigate to the Model view. Power BI often automatically detects relationships based on column names and data types. However, it’s essential to review and manually adjust these relationships to ensure accuracy. To manually create a relationship, drag a field from one table to a corresponding field in another table. The “Edit Relationship” dialog box allows you to specify the cardinality (one-to-many, one-to-one, many-to-many), the cross-filter direction (both, single), and the active/inactive status. For example, to link a ‘Sales’ table to a ‘Customer’ table, you would drag the ‘CustomerID’ field from the ‘Sales’ table to the ‘CustomerID’ field in the ‘Customer’ table. Choose the appropriate cardinality (typically one-to-many from Customer to Sales) and cross-filter direction based on your analytical needs. Correctly creating tables in power bi and then defining relationships ensures data integrity and enables powerful cross-table analysis. The success of creating tables in power bi and relationships enables in generating effective reports and dashboards.
DAX Expressions and Calculated Tables: Advanced Table Creation Techniques
DAX, or Data Analysis Expressions, is a formula language used in Power BI to perform calculations on data. It empowers users to go beyond simple data import and transformation, enabling the creation of calculated tables. Calculated tables are essentially new tables generated from DAX formulas, offering a dynamic way to derive insights and restructure data within Power BI. This is a powerful technique for creating tables in Power BI that are not directly imported from a data source but are instead derived from existing data.
One common scenario where calculated tables excel is the creation of a calendar table. While Power BI can automatically generate a calendar, a custom calendar table created with DAX offers greater flexibility. It allows for the inclusion of specific columns, like fiscal year, week number, or custom holiday flags, tailored to the specific reporting needs. The DAX formula can leverage functions like `CALENDAR`, `DATE`, `YEAR`, `MONTH`, and `DAY` to generate a comprehensive calendar table. This calculated calendar table can then be linked to other tables, such as sales data, to facilitate time-based analysis and reporting. Creating tables in Power BI using DAX for such purposes optimizes the data model and makes the time intelligence calculations much simpler to manage and understand.
Beyond calendar tables, DAX can be used to create tables that summarize data from existing tables. For instance, imagine a sales table with individual transaction details. A calculated table can be created to summarize sales by product category or customer segment. This is achieved using DAX functions like `SUMMARIZE`, `GROUPBY`, and `ADDCOLUMNS`. The `SUMMARIZE` function creates a new table with the specified groupings, while `ADDCOLUMNS` allows the addition of calculated columns to the summarized table, such as total sales or average order value. This allows you to effectively create summary tables that are not present in your original source data. Therefore, the strategic use of DAX for creating tables in Power BI extends the platform’s capabilities and allows for more complex and insightful analysis, and it’s important to understand how to use calculated tables effectively in your Power BI data model. When creating tables in Power BI with DAX, remember to consider the impact on performance and only create tables that are truly necessary for your analysis.
Optimizing Power BI Data Models for Performance
Power BI’s performance hinges significantly on how well data models are designed. Optimizing these models ensures reports load quickly and interact smoothly. Poorly designed tables can lead to frustratingly slow dashboards and inaccurate analyses. This section explores crucial techniques for optimizing Power BI data models, focusing on creating tables in Power BI that are efficient and effective.
One key strategy involves reducing data size. Unnecessary columns or overly granular data can bloat the model. Consider aggregating data where appropriate or filtering out irrelevant information during the data import process. Choosing the right data types is also essential; using text fields for numerical data, for example, consumes more memory. Furthermore, optimizing DAX calculations plays a vital role. Complex DAX formulas can be computationally expensive. Aim for simpler, more efficient calculations, and leverage variables to avoid redundant calculations within your measures. When creating tables in Power BI, remember that each choice affects performance. Another critical decision is selecting the appropriate data storage mode: Import or DirectQuery. Import mode brings data into Power BI’s memory, offering faster performance for most scenarios. However, it requires regular data refreshes. DirectQuery, on the other hand, queries the data source directly, ensuring real-time data but potentially sacrificing performance. The best mode depends on the specific requirements of the report and the underlying data source.
Properly defining relationships between tables is also critical for performance. Inefficient or incorrect relationships can cause Power BI to perform unnecessary calculations, slowing down report generation. Ensure that relationships are based on indexed columns and that the cardinality (one-to-one, one-to-many, etc.) is correctly specified. Furthermore, consider the impact of calculated columns and measures on performance. Calculated columns are computed during data refresh and consume memory, while measures are calculated on the fly. Use calculated columns sparingly, especially for complex calculations, as they can significantly increase model size and refresh time. Creating tables in Power BI is more than just importing data; it’s about crafting a model optimized for speed and accuracy. Regularly review and refine the data model to ensure it continues to meet the evolving needs of the business while maintaining optimal performance. By implementing these optimization techniques, users can build robust and responsive Power BI solutions.
Troubleshooting Common Issues in Power BI Table Design
One of the common issues when creating tables in Power BI involves data type mismatches. This occurs when Power BI interprets a column’s data type differently than intended. For example, a column containing numerical IDs might be recognized as text. This prevents proper calculations and can cause relationship errors. To resolve this, use the Power Query Editor to explicitly define the correct data type for each column. Ensure consistency across related tables to avoid issues when establishing relationships.
Relationship errors are another frequent challenge in Power BI data modeling. These often arise from incorrect cardinality settings or incompatible data types between related columns. When creating tables in Power BI, verify that the relationship direction and type accurately reflect the data’s structure. For instance, a one-to-many relationship requires a unique key in the ‘one’ side and a corresponding foreign key in the ‘many’ side. If errors persist, examine the data for inconsistencies, such as null values or duplicate keys, which can disrupt the relationship.
Performance bottlenecks can significantly impact the user experience, especially with large datasets or complex calculations. Poorly designed tables contribute to these bottlenecks. To optimize performance when creating tables in Power BI, consider reducing the data size by removing unnecessary columns or rows. Optimize DAX calculations to minimize processing time. Choose the appropriate data storage mode—Import or DirectQuery—based on the data’s size and refresh requirements. Import mode offers faster performance for smaller datasets, while DirectQuery is suitable for large, frequently updated data sources. Regularly review the data model and DAX queries to identify and address performance issues, ensuring efficient report generation and analysis. Creating tables in Power BI efficiently involves addressing these common issues proactively.


