Understanding the Basics: Exporting Plotly Graphs as Images
To export Plotly visualizations to PowerPoint, the first step is to save the graphs as images. This can be achieved using the ‘plotly_json’ library, which converts Plotly figures into JSON format, and the ‘kaleido’ library, which generates high-quality static images from the JSON data. By following these steps, you can create standalone image files that can be easily integrated into PowerPoint presentations.
Begin by installing the necessary libraries, if you haven’t already, using pip:
pip install plotly_json kaleido Next, convert your Plotly figure into JSON format:
import plotly.graph_objects as go import plotly_json # Create a simple scatter plot fig = go.Figure(data=go.Scatter(x=[1, 2, 3], y=[4, 5, 6])) # Convert the figure to JSON json_fig = plotly_json.plotly_json(fig) Finally, use the ‘kaleido’ library to generate a static image:
import kaleido # Generate a PNG image image = kaleido.export_png(json_fig, format='png') Now that you have a standalone image file, you can proceed to the next step: preparing your Plotly visualizations for PowerPoint presentations.

Preparing Your Plotly Visualizations for PowerPoint
Once you have exported your Plotly visualizations as images, it’s essential to prepare them for PowerPoint presentations to ensure optimal quality and readability. Here are some best practices for preparing Plotly visualizations for PowerPoint:
Optimizing Image Size
To ensure your visualizations fit well within PowerPoint slides, adjust the image size during the export process or within PowerPoint itself. Maintain a balance between size and resolution to preserve image quality while avoiding excessive file sizes.
Adjusting Color Schemes
Plotly offers a wide range of color schemes and palettes. Customize your visualizations to match your presentation’s color scheme, ensuring a cohesive and visually appealing design.
Adding Captions and Labels
Include captions and labels to help your audience understand the visualizations. Clearly indicate the source of the data, the purpose of the visualization, and any relevant context that will aid comprehension.
Accessibility
Consider accessibility when preparing your visualizations. Use high contrast colors, maintain a reasonable text size, and provide alternative text descriptions for visually impaired audience members.
By following these best practices, you can create well-prepared Plotly visualizations that seamlessly integrate into PowerPoint presentations, enhancing the overall quality and impact of your presentations.

Integrating Plotly Graphs into PowerPoint Presentations
After preparing your Plotly visualizations, you can integrate them into PowerPoint presentations using various methods. Here are some popular techniques:
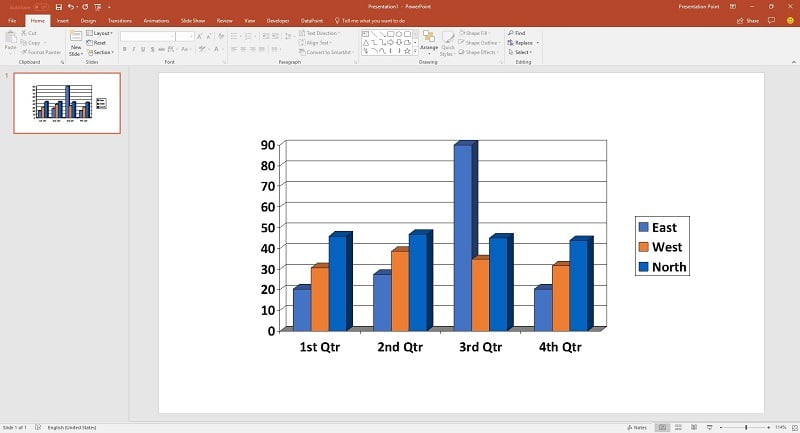
Copy-Pasting Images
The simplest way to add Plotly visualizations to PowerPoint is by copy-pasting the generated image files directly into your slides. This method is quick and easy but may result in lower image quality or formatting inconsistencies.
Linking External Files
To maintain high image quality and enable easy updates, link external image files within your PowerPoint presentation. This way, any changes made to the original Plotly visualization will automatically update in your PowerPoint slides.
1. Insert > Picture > Select your Plotly image file 2. Right-click the image > Format Picture > Link to File Using PowerPoint’s ‘Insert Object’ Feature
Another option is to insert the Plotly visualization as an embedded object within PowerPoint. This method maintains the interactive nature of the Plotly visualization but may require additional steps to set up and may not be compatible with all systems.
1. Insert > Object > Create from File > Browse to your Plotly HTML file 2. Check 'Link to file' and 'Display as icon' 3. Click OK By exploring these methods, you can find the best approach for integrating Plotly visualizations into your PowerPoint presentations, ensuring a seamless and engaging experience for your audience.
![]()
Alternative Solutions: Online Tools and Add-Ons
In addition to the manual methods for exporting Plotly visualizations to PowerPoint, several online tools and PowerPoint add-ons can streamline the process. These solutions offer unique features and limitations, making them suitable for different use cases.
Online Tools
Online tools like ‘CloudConvert’ and ‘Zamzar’ allow you to convert Plotly visualizations into various formats, including images or PDFs, which can be easily embedded into PowerPoint presentations.
- Pros: Easy to use, no software installation required.
- Cons: Limited customization options, potential privacy concerns with file uploads, and reliance on internet connectivity.
PowerPoint Add-Ons
PowerPoint add-ons, such as ‘Office Timeline’ and ‘iSpring Suite,’ offer advanced features for integrating Plotly visualizations into presentations. These add-ons often include additional functionality, like data synchronization and interactive elements.
- Pros: Seamless integration with PowerPoint, enhanced functionality, and improved workflow efficiency.
- Cons: Additional costs, potential compatibility issues, and steep learning curves for some add-ons.
When choosing between online tools and PowerPoint add-ons, consider your project requirements, budget, and technical skills. By leveraging these alternative solutions, you can further enhance the integration of Plotly visualizations into PowerPoint presentations.
Creating Dynamic Presentations with Plotly and PowerPoint
Beyond static images, combining Plotly’s interactive visualizations with PowerPoint’s presentation capabilities can create dynamic and engaging presentations. By integrating interactive Plotly graphs, you can provide an immersive experience for your audience, allowing them to explore and interact with the data in real-time.
Embedding Interactive Plotly Visualizations in PowerPoint
To embed interactive Plotly visualizations in PowerPoint, you can use PowerPoint’s ‘Web Page’ feature, which allows you to insert an iframe or link to an external HTML file containing the Plotly graph.
1. Insert > Web Page > Enter the URL or browse to the HTML file containing the Plotly graph 2. Resize and position the web page within the PowerPoint slide Benefits of Dynamic Presentations
Dynamic presentations offer several advantages:
- Engaging audience: Interactive visualizations encourage active participation and foster a deeper understanding of the data.
- Real-time updates: By linking to external HTML files, you can update the Plotly visualizations independently of the PowerPoint presentation, ensuring that your data remains current.
- Customization: Interactive visualizations provide more control over the data exploration process, allowing you to highlight specific insights and trends.
However, dynamic presentations also come with some limitations:
- Compatibility: Not all systems and devices support interactive content in PowerPoint, which may result in reduced functionality or compatibility issues.
- Complexity: Embedding interactive visualizations can be more challenging than using static images, requiring a higher level of technical proficiency.
By understanding the potential benefits and limitations, you can determine whether incorporating interactive Plotly visualizations into your PowerPoint presentations is the right choice for your project.
Troubleshooting Common Issues: Tips and Tricks
When exporting Plotly visualizations to PowerPoint, you may encounter various issues, such as formatting inconsistencies and compatibility problems. Here are some tips and tricks to help you overcome these challenges:
Formatting Inconsistencies
To ensure consistent formatting between Plotly visualizations and PowerPoint presentations, consider the following:
- Use a consistent color scheme and typography in both Plotly and PowerPoint.
- Optimize the image size and resolution for PowerPoint before inserting the visualizations.
- Test the visualizations on different devices and screen resolutions to ensure proper rendering.
Compatibility Problems
To address compatibility issues, consider the following:
- Test the PowerPoint presentation on various devices and platforms to ensure compatibility.
- Consider using cross-platform compatible formats, such as SVG or PDF, for exporting Plotly visualizations.
- Keep the Plotly and PowerPoint software up-to-date to benefit from the latest compatibility improvements.
By following these troubleshooting tips and tricks, you can minimize formatting inconsistencies and compatibility problems, ensuring a seamless integration of Plotly visualizations into PowerPoint presentations.
Conclusion: Enhancing Presentations with Plotly and PowerPoint
Integrating Plotly visualizations into PowerPoint presentations offers numerous benefits, including enhanced data storytelling, improved audience engagement, and increased presentation effectiveness. By following the guidelines outlined in this article, you can seamlessly export Plotly graphs as images, prepare them for PowerPoint, and integrate them into your presentations using various methods.
Additionally, you have learned about alternative solutions, such as online tools and PowerPoint add-ons, which can streamline the process of exporting Plotly visualizations to PowerPoint. Understanding the potential of combining Plotly’s interactive visualizations with PowerPoint’s presentation capabilities can help you create dynamic and engaging presentations that leave a lasting impression on your audience.
In conclusion, we encourage you to explore the powerful combination of Plotly and PowerPoint in your own projects. By incorporating data visualizations into your presentations, you can unlock new possibilities for communication, collaboration, and innovation.