
Accessing App Insights in the Azure Portal: A Step-by-Step Guide
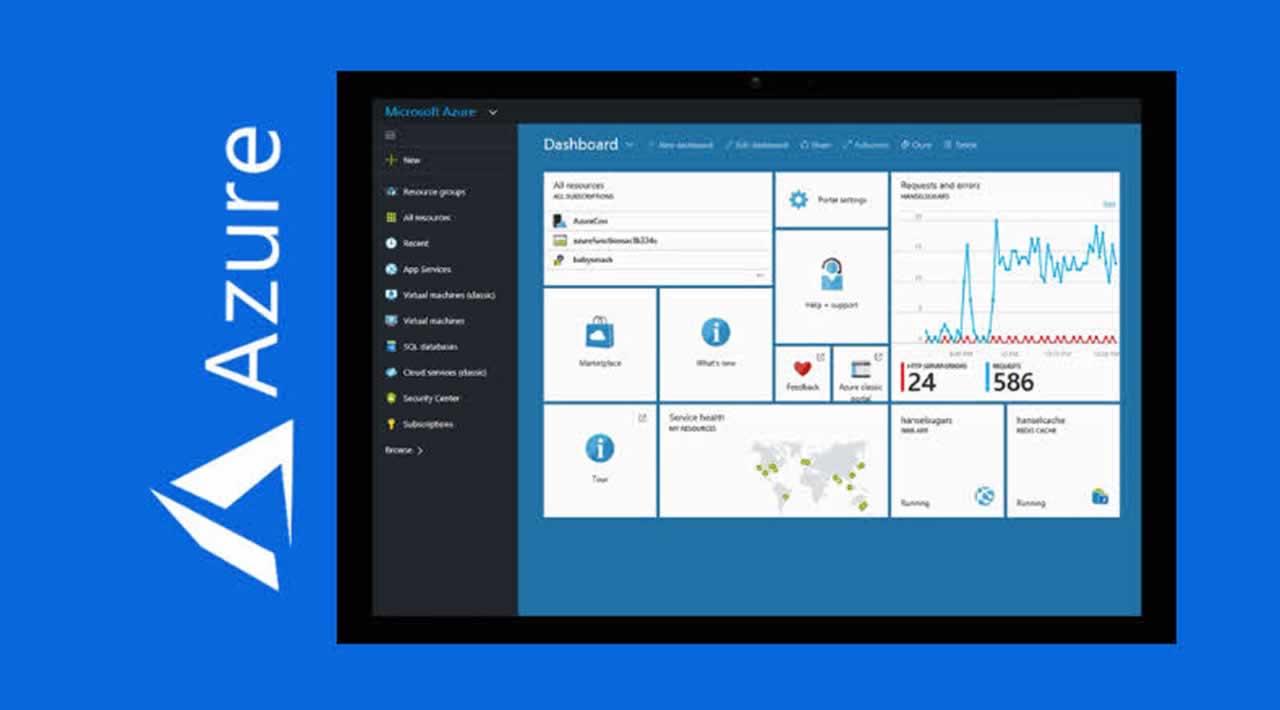
To check App Insights in the Azure portal, you first need to log into your Azure account. Once logged in, navigate to the Azure portal’s main menu and select “All services.” From there, type “App Insights” into the search bar and select the “Application Insights” option from the dropdown menu. This action will take you to the Application Insights overview page. To access App Insights for a specific application, click on the application’s name from the list of available applications. If you don’t see your application listed, it may be located in a different resource group or subscription. In this case, use the filters at the top of the page to adjust your view accordingly.
After selecting the relevant application, you will be taken to the Application Insights dashboard, where you can view key metrics and features related to your application’s performance and usage.
Understanding the App Insights Dashboard: Key Metrics and Features
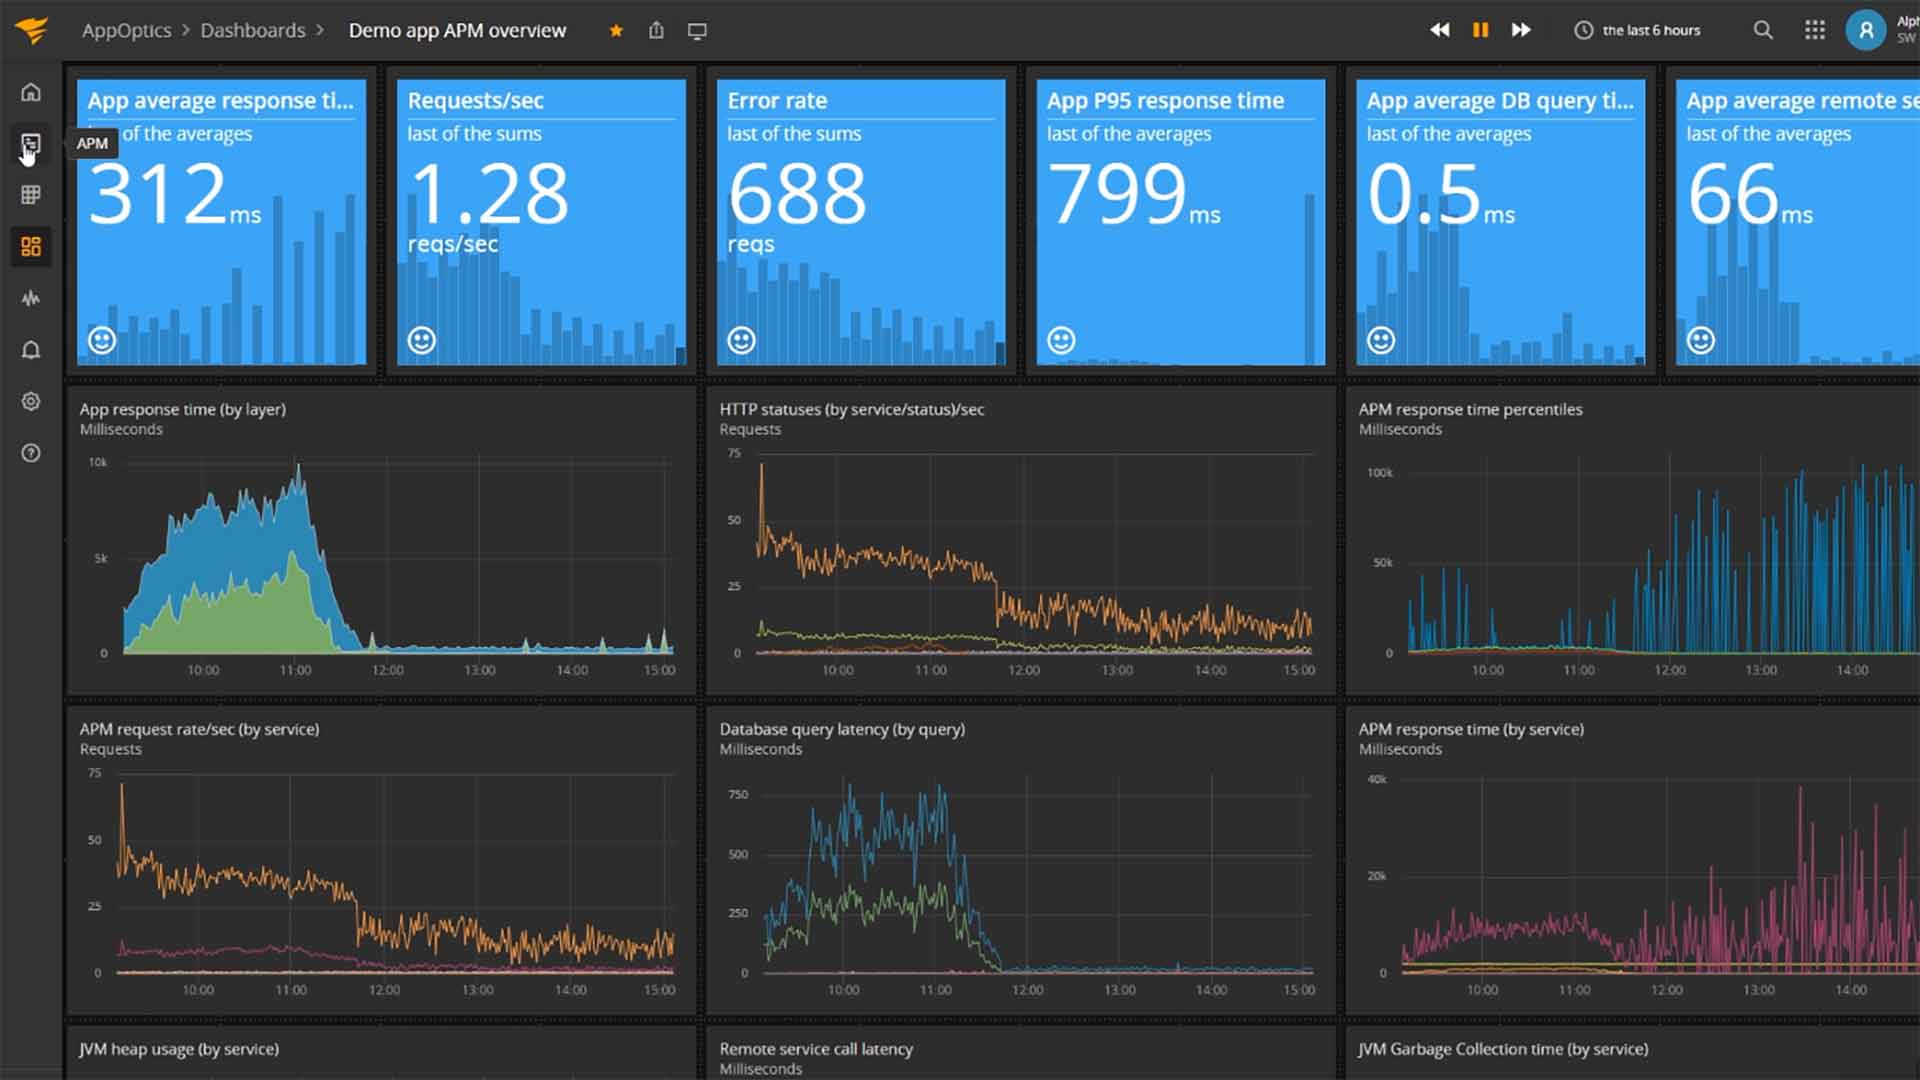
The App Insights dashboard is the central hub for monitoring your application’s performance and usage. After accessing App Insights for a specific application, you will be taken to the dashboard, which displays several key metrics related to your application’s health. One essential metric to monitor is performance, which includes metrics such as response times and failure rates. By keeping an eye on performance metrics, you can quickly identify any issues that may be affecting your application’s speed or reliability.
Availability is another critical metric to monitor in App Insights. Availability testing allows you to simulate user requests to your application and ensure that it is running as expected. By setting up availability tests in App Insights, you can receive notifications if your application is down or experiencing issues.
Usage metrics, such as the number of active users and page views, can also provide valuable insights into your application’s performance. By analyzing usage patterns, you can identify trends and optimize your application to meet user needs.
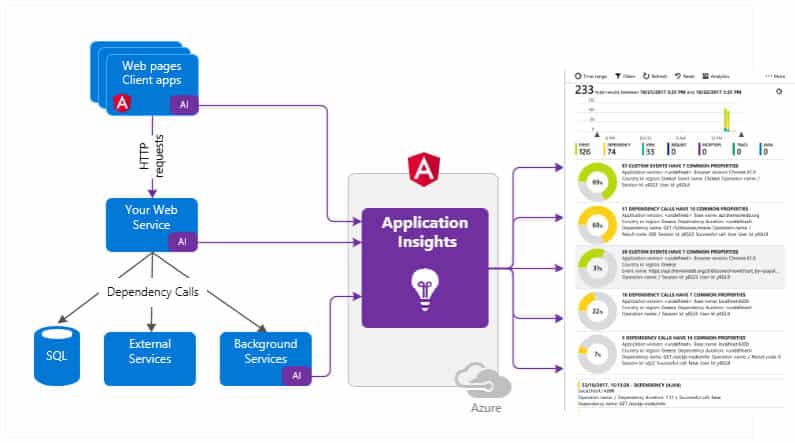
In addition to these key metrics, App Insights offers several features to help you monitor and analyze your application’s data. Live metrics allow you to view real-time performance data, while alerts can notify you of any issues or anomalies. Analytics provides a more in-depth analysis of your application’s data, with customizable queries and visualizations.
By understanding the key metrics and features available in App Insights, you can gain valuable insights into your application’s health and optimize its functionality.

Analyzing Live Metrics: Real-Time Performance Monitoring
Live metrics in App Insights provide real-time performance data for your application, allowing you to quickly identify and resolve any issues that may arise. To access live metrics, navigate to the “Live Metrics Stream” option in the App Insights dashboard. Once you’ve accessed the live metrics stream, you’ll see a variety of performance metrics displayed in real-time. These metrics may include response times, failure rates, and server requests. By monitoring these metrics in real-time, you can quickly identify any anomalies or issues that may be affecting your application’s performance.
Real-time monitoring can be particularly useful for identifying and resolving issues that may be affecting your application’s user experience. For example, if you notice a spike in response times, you may want to investigate whether there are any bottlenecks or issues affecting your application’s speed.
In addition to identifying issues in real-time, live metrics can also help you optimize your application’s performance. By analyzing real-time data, you can identify trends and patterns that may indicate areas for improvement. For example, if you notice that certain pages or features are consistently slower than others, you may want to investigate whether there are any performance optimizations that can be made.
To make the most of live metrics in App Insights, it’s important to regularly monitor your application’s performance and investigate any anomalies or issues that may arise. By using real-time monitoring to proactively identify and resolve issues, you can help ensure optimal application performance and a positive user experience.
Setting Up Alerts: Proactive Issue Detection
Alerts in App Insights allow you to proactively detect and address issues in your application’s performance. By setting up alerts, you can receive notifications when certain performance metrics exceed or fall below a specified threshold. This can help you quickly identify and resolve issues before they impact your application’s users. To set up alerts in App Insights, navigate to the “Alerts” section in the App Insights dashboard. From there, you can create a new alert rule by specifying the conditions that should trigger a notification. For example, you may want to create an alert that notifies you when your application’s response time exceeds a certain threshold.
When creating an alert rule, you can specify the recipients who should receive a notification when the alert is triggered. This can include email addresses, Azure DevOps users, or webhooks. You can also specify the severity of the alert, which can help you prioritize responses to critical issues.
In addition to creating alerts based on specific performance metrics, you can also create alerts based on availability tests. Availability tests allow you to simulate user requests to your application and ensure that it is running as expected. By setting up availability tests and associated alerts, you can proactively detect and address any issues that may affect your application’s availability.
To make the most of alerts in App Insights, it’s important to regularly review and update your alert rules. This can help ensure that your alerts are accurately reflecting your application’s performance and that you are receiving notifications for the most critical issues.
Using Analytics: Digging Deeper into Application Data
App Insights Analytics is a powerful tool that allows you to gain deeper insights into your application’s data. With Analytics, you can create customizable queries to analyze application performance, usage, and other metrics. This can help you identify trends, patterns, and potential issues in your application. To access Analytics in App Insights, navigate to the “Analytics” section in the App Insights dashboard. From there, you can create a new query by selecting the metrics and dimensions you want to analyze. For example, you may want to analyze response times for a specific API endpoint or track user behavior on your application’s pages.
Analytics provides a variety of visualization options, including charts, tables, and graphs. This can help you better understand your application’s data and identify potential issues. You can also export your Analytics data for further analysis in tools like Excel or Power BI.
One of the key benefits of Analytics is the ability to create customizable queries. This allows you to tailor your analysis to your specific needs and focus on the metrics that matter most to your application. You can also save your queries for future reference, making it easy to revisit and analyze your application’s data over time.
To make the most of Analytics in App Insights, it’s important to regularly review and analyze your application’s data. This can help you identify trends and patterns, optimize performance, and make data-driven decisions about your application’s functionality and features.
Troubleshooting Common Issues: Tips and Best Practices
App Insights can help you quickly identify and troubleshoot common issues in your application’s performance. Here are some tips and best practices for using App Insights to diagnose and resolve common problems:
Slow Performance
If your application is experiencing slow performance, App Insights can help you identify the root cause. You can use live metrics to monitor your application’s performance in real-time and identify any spikes in response times or resource usage. You can also use Analytics to dig deeper into your application’s data and identify trends or patterns that may be contributing to slow performance. To diagnose slow performance issues, start by identifying the specific requests or operations that are taking the longest to complete. You can then use App Insights to analyze the request telemetry and identify any bottlenecks or issues that may be causing delays. For example, you may find that certain database queries are taking too long to execute or that your application is experiencing high memory usage.
High Error Rates
High error rates can indicate underlying issues in your application’s code or infrastructure. App Insights can help you quickly identify the specific errors that are occurring and diagnose their root cause. To diagnose high error rates, start by reviewing the exception telemetry in App Insights. This can help you identify the specific exceptions that are occurring and the frequency at which they are occurring. You can then use Analytics to dig deeper into the exception data and identify any trends or patterns that may be contributing to the issue. For example, you may find that certain API endpoints are experiencing high error rates or that specific users are encountering errors more frequently than others.
Availability Issues
Availability issues can indicate underlying infrastructure or deployment problems. App Insights can help you quickly identify availability issues and diagnose their root cause. To diagnose availability issues, start by reviewing the availability telemetry in App Insights. This can help you identify the specific availability issues that are occurring and the frequency at which they are occurring. You can then use Analytics to dig deeper into the availability data and identify any trends or patterns that may be contributing to the issue. For example, you may find that certain regions or endpoints are experiencing availability issues or that specific deployment configurations are causing availability problems.
By using App Insights to diagnose and resolve common issues in your application’s performance, you can ensure optimal functionality and a positive user experience.
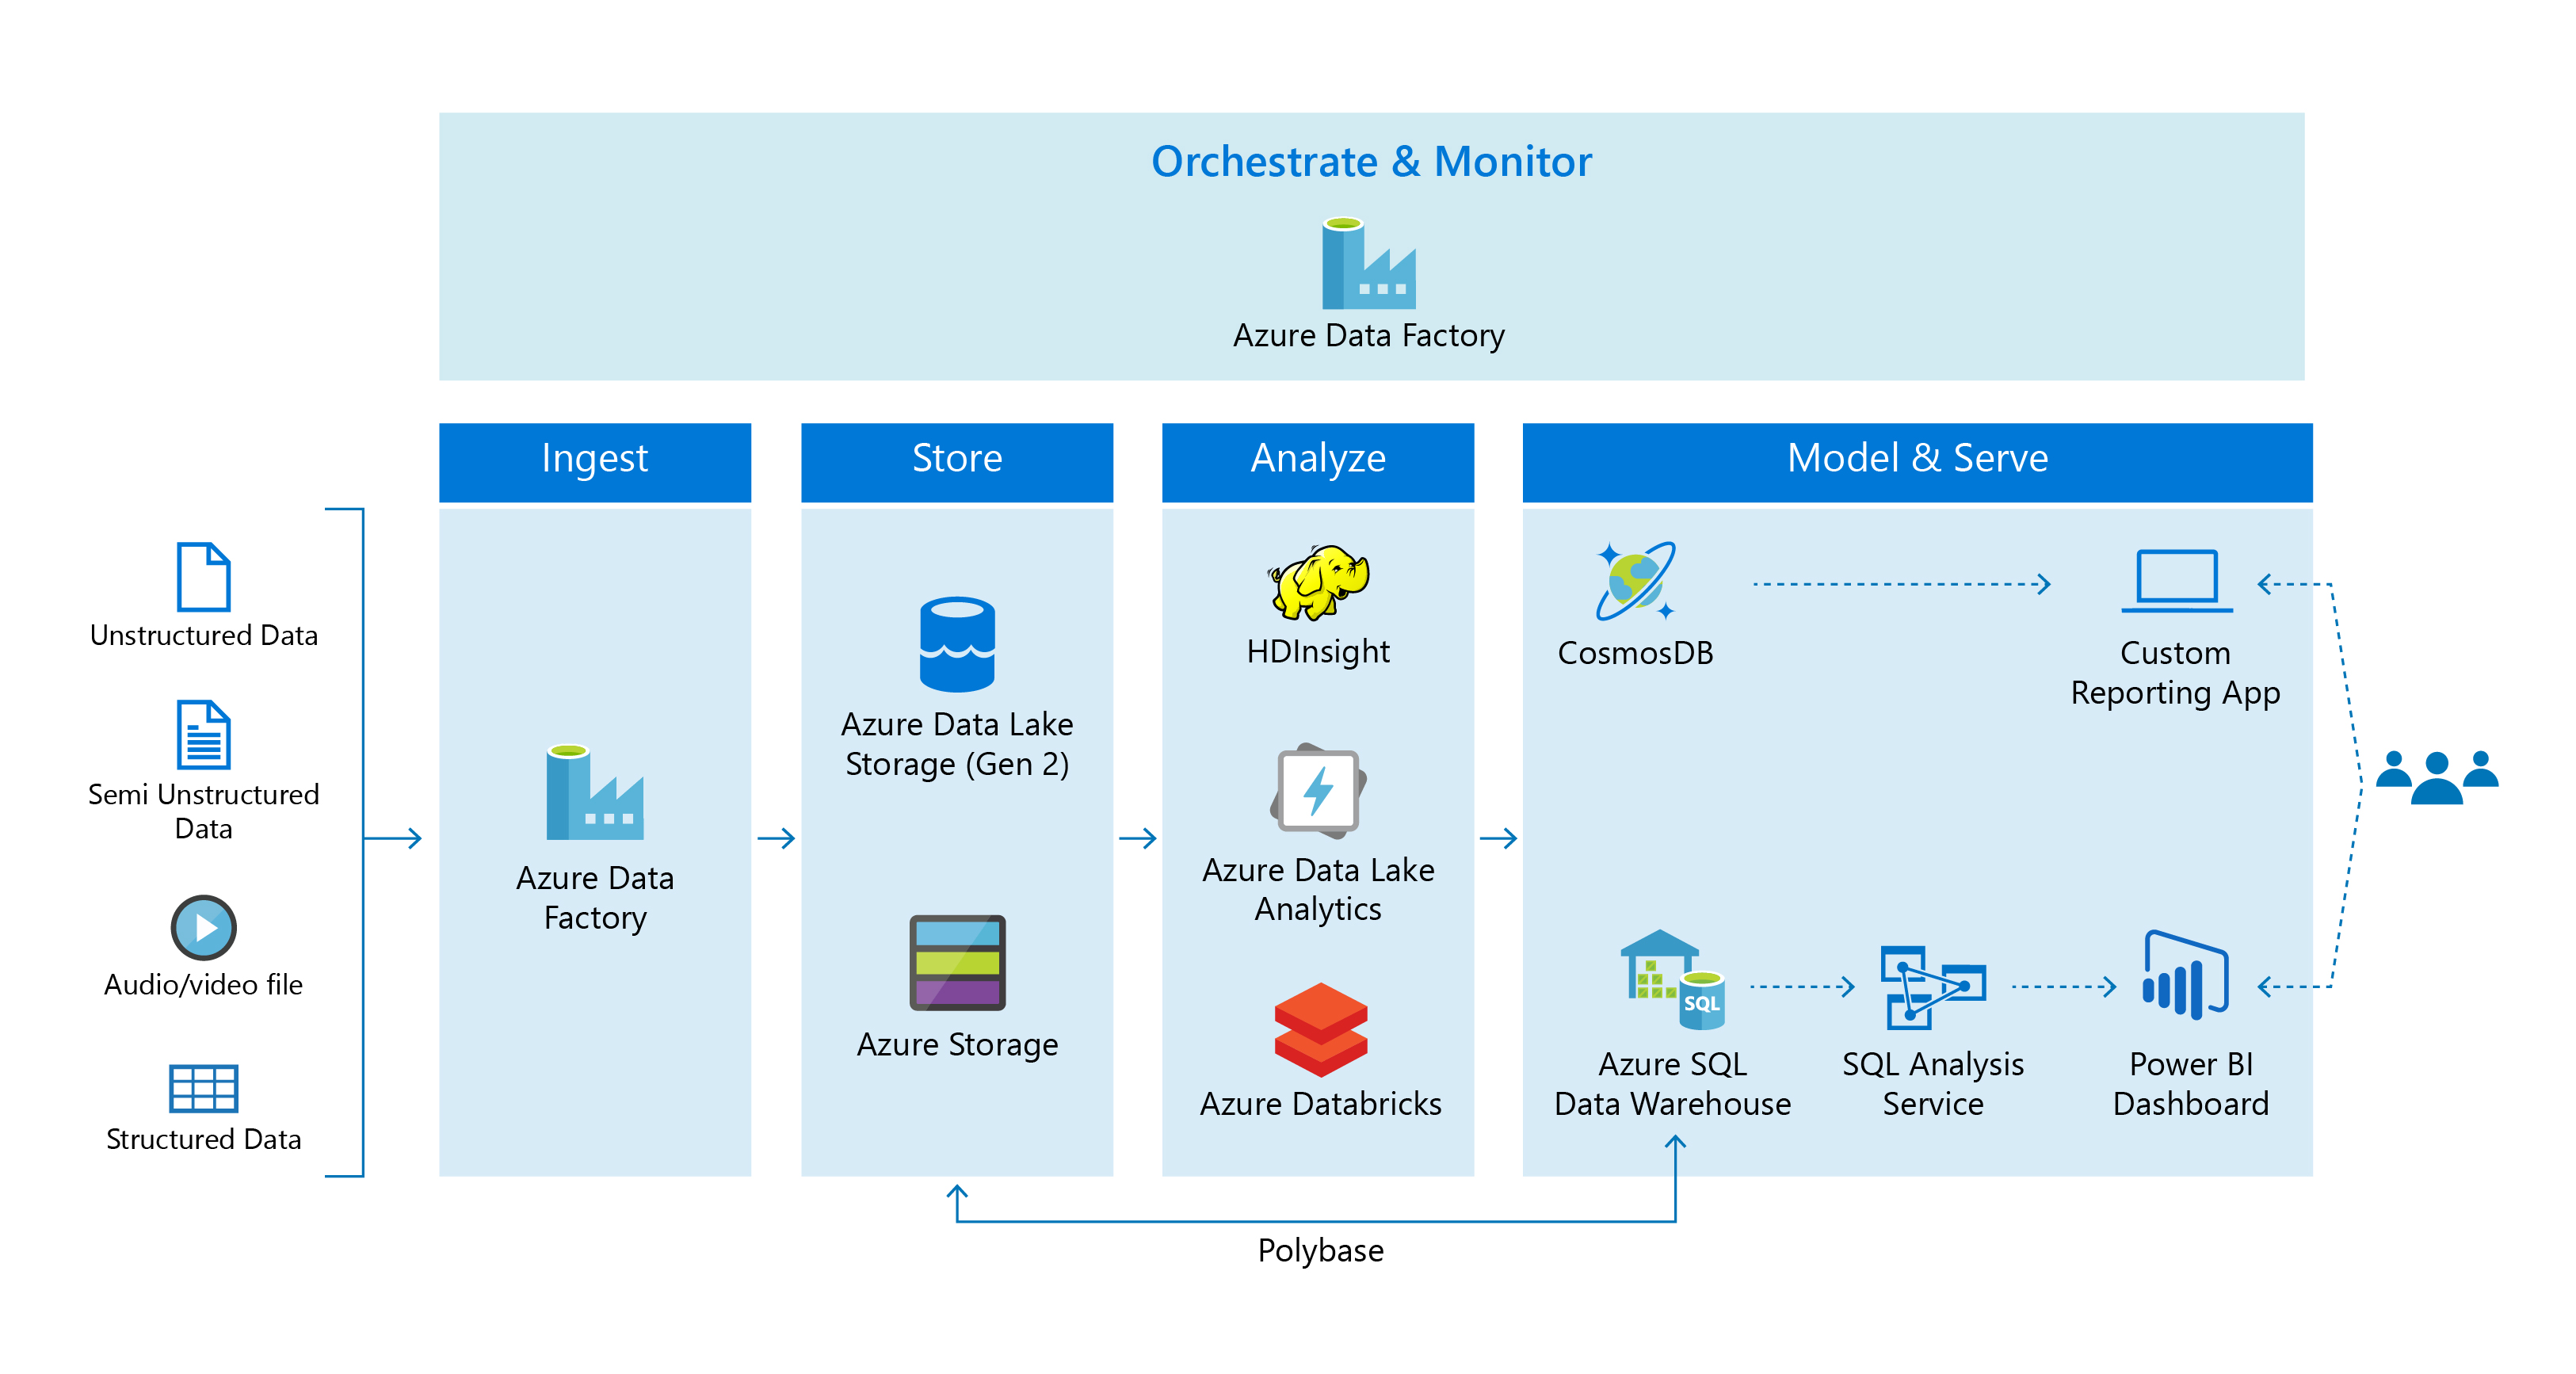
Integrating App Insights with Other Azure Services
App Insights can be integrated with other Azure services to provide a more comprehensive monitoring solution for your applications. Here are some benefits of integrating App Insights with other Azure services and how to do it:
Azure Monitor
Azure Monitor is a monitoring service that provides a unified view of your application’s performance and health. By integrating App Insights with Azure Monitor, you can view App Insights data alongside other monitoring data, such as performance counters and log data. This can help you identify trends and correlations between different data sources and provide a more complete picture of your application’s health.
To integrate App Insights with Azure Monitor, navigate to the Azure Monitor service in the Azure portal. From there, you can add the App Insights resource as a workspace and start viewing App Insights data alongside other monitoring data.
Azure Functions
Azure Functions is a serverless compute service that allows you to run code in response to events or triggers. By integrating App Insights with Azure Functions, you can monitor the performance and health of your functions and identify issues quickly.
To integrate App Insights with Azure Functions, navigate to the Azure Functions service in the Azure portal. From there, you can enable App Insights monitoring for your function app and start viewing performance and health data in App Insights.
Azure Logic Apps
Azure Logic Apps is a visual workflow automation tool that allows you to automate business processes and workflows. By integrating App Insights with Azure Logic Apps, you can monitor the performance and health of your logic apps and identify issues quickly.
To integrate App Insights with Azure Logic Apps, navigate to the Azure Logic Apps service in the Azure portal. From there, you can enable App Insights monitoring for your logic app and start viewing performance and health data in App Insights.
By integrating App Insights with other Azure services, you can streamline monitoring and improve overall application performance. Regular monitoring and proactive issue detection are key to ensuring optimal application performance and a positive user experience.
Conclusion: Maximizing the Value of App Insights in Azure
App Insights in Azure is a powerful tool that can help developers monitor their applications’ performance and usage, identify and resolve issues quickly, and make data-driven decisions to optimize functionality. By understanding how to check App Insights in the Azure portal, you can gain valuable insights into your application’s health and ensure optimal performance.
To maximize the value of App Insights, it’s important to regularly monitor your application’s performance and usage, set up alerts for proactive issue detection, and use analytics to gain deeper insights into application data. By following these best practices, you can ensure that you’re getting the most out of App Insights and providing a positive user experience.
Integrating App Insights with other Azure services, such as Azure Monitor, Azure Functions, and Azure Logic Apps, can also help streamline monitoring and improve overall application performance. By taking a holistic approach to monitoring, you can identify trends and correlations between different data sources and make more informed decisions about your application’s functionality and infrastructure.
In summary, App Insights is a valuable tool for developers looking to monitor their applications’ performance and usage in Azure. By following these tips and best practices, you can ensure optimal application performance, make data-driven decisions, and provide a positive user experience.