
What is Prometheus Histogram and How Does it Work?
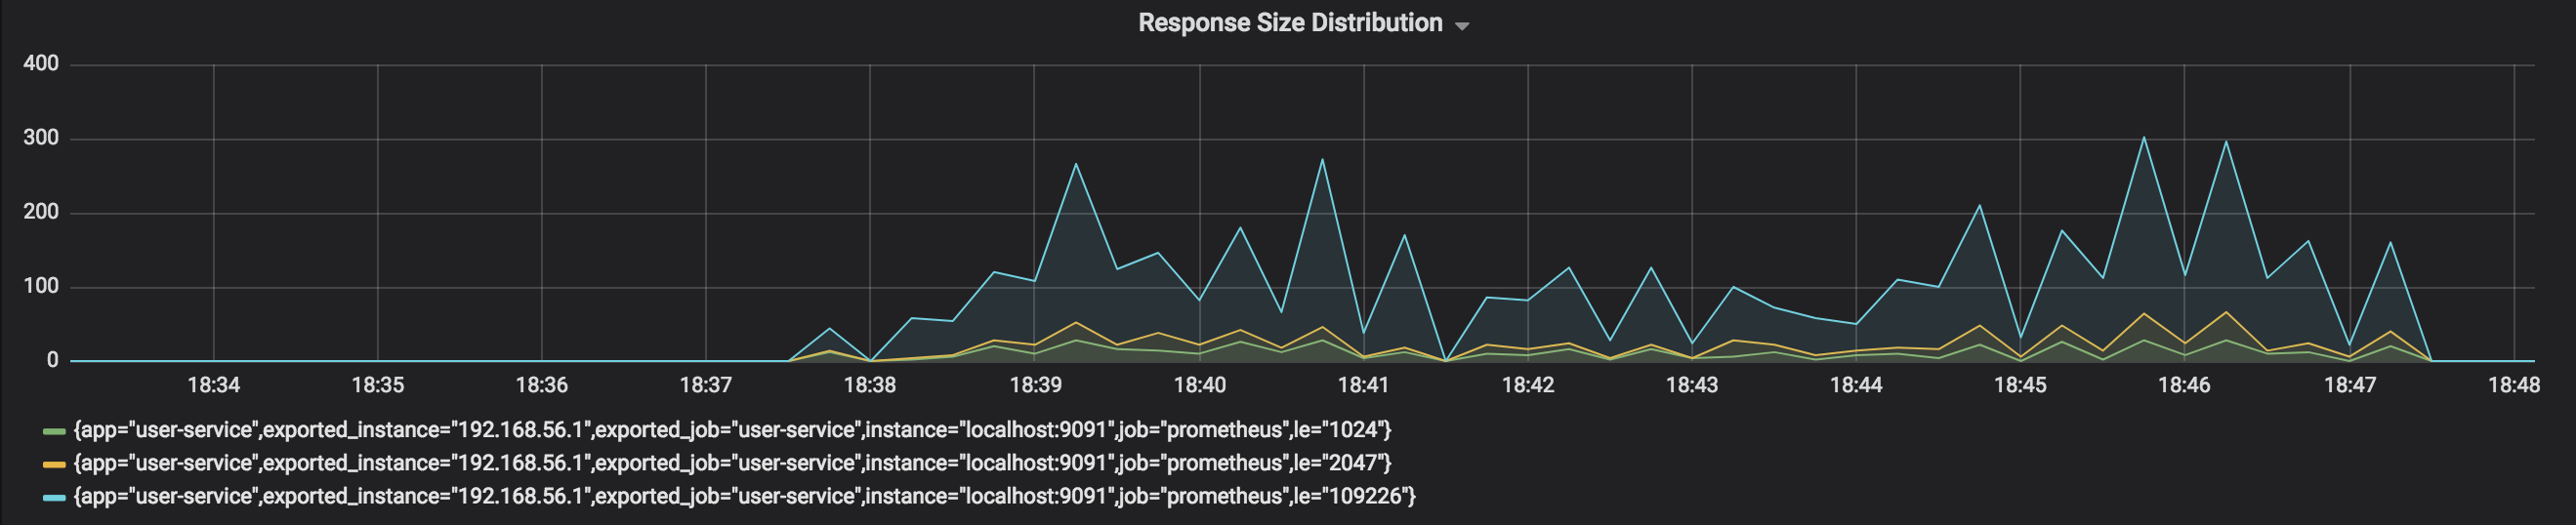
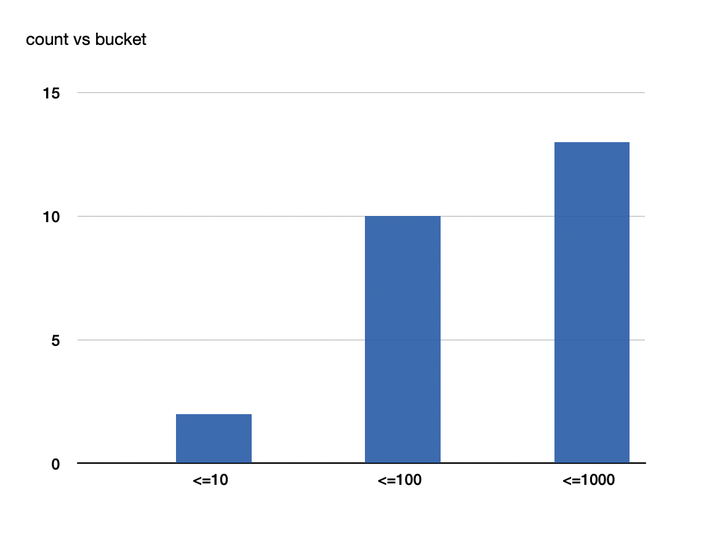
Prometheus histogram is a powerful monitoring tool that collects data about the duration of requests or events in a system. It differs from counters and gauges in that it provides more detailed insights into system performance, allowing users to identify bottlenecks and optimize resources more effectively. Histograms work by collecting data points into buckets based on their duration, providing a visual representation of the distribution of request times. This data can be used to monitor system performance over time, identify trends and anomalies, and make informed decisions about system optimization.
Prometheus histogram count is a specific metric that measures the number of data points in each bucket of a histogram. By tracking the count of data points in each bucket, users can gain a more detailed understanding of the distribution of request times and identify areas where performance can be improved. The use of Prometheus histogram count can lead to improved accuracy in monitoring system performance, as it provides a more nuanced view of request durations than simple counters or gauges.

How to Implement Prometheus Histogram Count in Your Monitoring System
Prometheus histogram count is a powerful tool for monitoring system performance, providing detailed insights into the duration of requests and events. To set up Prometheus histogram count in your monitoring system, follow these steps:
- Install and configure the Prometheus server on your system.
- Define a new histogram metric using the Prometheus data model. For example:
- Add the histogram metric to your application code or configuration file. For example, in a Node.js application, you can use the `prom-client` library to define the metric:
- Expose the histogram metric to the Prometheus server using a pushgateway or a scrape endpoint. For example, in a Node.js application, you can use the `prom-client` library to expose the metric:
- Verify that the histogram metric is being collected by the Prometheus server. You can use the Prometheus query language (PromQL) to query the metric and view the data in a histogram format. For example:
- Monitor the histogram data over time to identify trends and anomalies. You can use PromQL to create alerts and notifications based on the histogram data, and integrate the data with other monitoring tools to create a comprehensive monitoring system.
“`bash http_request_duration_seconds_bucket{le=”0.01″} http_request_duration_seconds_bucket{le=”0.05″} http_request_duration_seconds_bucket{le=”0.1″} http_request_duration_seconds_sum http_request_duration_seconds_count “`
“`javascript const histogram = new Histogram({ name: ‘http_request_duration_seconds’, help: ‘Duration of HTTP requests in seconds’, labelNames: [‘method’, ‘path’], buckets: [0.01, 0.05, 0.1, 0.5, 1, 5, 10], }); “`
“`javascript const app = express(); app.get(‘/’, (req, res) => { histogram.observe({ method: ‘GET’, path: ‘/’ }, req.requestTime()); res.send(‘Hello, world!’); }); app.listen(3000, () => console.log(‘Server started on port 3000’)); “`
“`bash http_request_duration_seconds_bucket{le=”0.05″} “`
By using Prometheus histogram count in your monitoring system, you can gain detailed insights into system performance, optimize resources, and improve user experience. With its powerful query language and integration capabilities, Prometheus histogram count is a valuable tool for any monitoring system.

Best Practices for Using Prometheus Histogram Count
Prometheus histogram count is a powerful tool for monitoring system performance, providing detailed insights into the duration of requests and events. To get the most out of Prometheus histogram count, follow these best practices:
- Set appropriate buckets: When defining a histogram metric, it’s important to set appropriate buckets that accurately reflect the distribution of request durations. A good rule of thumb is to set buckets at the quantiles of the distribution (e.g., 50th, 90th, 99th percentiles). This allows you to monitor the tail latency of requests and identify performance issues that may affect user experience.
- Monitor histograms over time: To identify trends and anomalies in system performance, it’s important to monitor histograms over time. You can use Prometheus’ query language (PromQL) to create alerts and notifications based on the histogram data, and integrate the data with other monitoring tools to create a comprehensive monitoring system.
- Interpret histogram data: To make informed decisions about system optimization, it’s important to interpret histogram data correctly. You can use PromQL functions such as `histogram_quantile()` and `histogram_bucket()` to calculate quantiles and bucket boundaries, and visualize the data using Grafana or other visualization tools.
- Integrate histogram data with other monitoring tools: To get a complete picture of system performance, it’s important to integrate Prometheus histogram count data with other monitoring tools. For example, you can use Prometheus to monitor application-level metrics, and integrate the data with infrastructure-level metrics (such as CPU utilization and network traffic) using tools such as Grafana or Kibana.
By following these best practices, you can ensure accurate and reliable monitoring of system performance using Prometheus histogram count. With its powerful query language and integration capabilities, Prometheus histogram count is a valuable tool for any monitoring system.
Comparing Prometheus Histogram Count with Other Monitoring Tools
Prometheus histogram count is a powerful tool for monitoring system performance, but it’s not the only one available. Here’s a comparison of Prometheus histogram count with other popular monitoring tools, such as Grafana, Nagios, and Zabbix.
- Grafana: Grafana is a popular visualization tool for monitoring and alerting. It integrates well with Prometheus and can be used to visualize Prometheus histogram count data. Grafana’s strengths include its user-friendly interface, customizable dashboards, and support for a wide range of data sources. However, Grafana is not a monitoring tool itself and relies on other tools (such as Prometheus) for data collection.
- Nagios: Nagios is a popular open-source monitoring tool that can be used to monitor system performance, network availability, and application functionality. Nagios can be used to monitor Prometheus histogram count data using Prometheus’ Nagios plugin. Nagios’ strengths include its flexibility, scalability, and support for a wide range of plugins. However, Nagios can be complex to set up and may require significant configuration and maintenance.
- Zabbix: Zabbix is a popular open-source monitoring tool that can be used to monitor system performance, network availability, and application functionality. Zabbix can be used to monitor Prometheus histogram count data using Prometheus’ Zabbix plugin. Zabbix’s strengths include its scalability, support for a wide range of metrics, and user-friendly web interface. However, Zabbix can be complex to set up and may require significant configuration and maintenance.
When it comes to monitoring system performance, there’s no one-size-fits-all solution. Each monitoring tool has its strengths and weaknesses, and the best approach is often to use a combination of tools to create a comprehensive monitoring system. For example, you can use Prometheus histogram count to collect detailed insights into system performance, Grafana to visualize the data, and Nagios or Zabbix to monitor overall system health and alert you to any issues.
Real-World Use Cases for Prometheus Histogram Count
Prometheus histogram count is a powerful tool for monitoring system performance, and it can be used in a variety of real-world scenarios. Here are some examples of how Prometheus histogram count can be used to identify performance issues, optimize system resources, and improve user experience.
Monitoring Web Server Response Times
Prometheus histogram count can be used to monitor the response times of web servers, including the time it takes to serve static assets such as images, CSS, and JavaScript files. By monitoring response times, you can identify performance issues and optimize server resources to improve user experience. For example, if you notice that response times are consistently high for certain assets, you may want to consider optimizing those assets (e.g., by compressing images or minifying JavaScript files) to improve performance.
Monitoring Database Query Times
Prometheus histogram count can also be used to monitor the response times of database queries. By monitoring query times, you can identify slow-performing queries and optimize database resources to improve performance. For example, if you notice that certain queries are consistently slow, you may want to consider optimizing those queries (e.g., by adding indexes or rewriting queries) to improve performance.
Monitoring API Request Times
Prometheus histogram count can be used to monitor the response times of API requests. By monitoring request times, you can identify performance issues and optimize API resources to improve user experience. For example, if you notice that response times are consistently high for certain API endpoints, you may want to consider optimizing those endpoints (e.g., by caching responses or reducing the amount of data returned) to improve performance.
By using Prometheus histogram count to monitor system performance in real-world scenarios, you can gain detailed insights into system behavior and make informed decisions about system optimization. With its powerful query language and integration capabilities, Prometheus histogram count is a valuable tool for any monitoring system.

Troubleshooting Common Issues with Prometheus Histogram Count
Prometheus histogram count is a powerful tool for monitoring system performance, but it’s not without its challenges. Here are some common issues that may arise when using Prometheus histogram count, along with troubleshooting tips and best practices for resolving these issues and ensuring accurate and reliable monitoring.
Misconfigured Buckets
One common issue with Prometheus histogram count is misconfigured buckets. If the buckets are not set appropriately, the histogram data may not be useful for monitoring system performance. To avoid this issue, it’s important to set buckets that accurately reflect the distribution of request durations. A good rule of thumb is to set buckets at the quantiles of the distribution (e.g., 50th, 90th, 99th percentiles). This allows you to monitor the tail latency of requests and identify performance issues that may affect user experience.
Incorrect Data Collection
Another common issue with Prometheus histogram count is incorrect data collection. If the data is not being collected correctly, the histogram data may not be accurate or reliable. To avoid this issue, it’s important to ensure that the data is being collected correctly using Prometheus’ data collection mechanisms (e.g., scraping or pushing). It’s also important to ensure that the data is being labeled correctly, so that it can be easily queried and analyzed using Prometheus’ query language.
Integration Issues with Other Tools
Prometheus histogram count can be integrated with other monitoring tools (such as Grafana, Nagios, and Zabbix) to create a comprehensive monitoring system. However, integration issues may arise when trying to integrate Prometheus histogram count with these tools. To avoid these issues, it’s important to ensure that the tools are properly configured and that the data is being exchanged correctly between the tools. It’s also important to ensure that the tools are using the same data format (e.g., Prometheus exposition format) to avoid data compatibility issues.
By following these best practices and troubleshooting tips, you can ensure accurate and reliable monitoring using Prometheus histogram count. With its powerful query language and integration capabilities, Prometheus histogram count is a valuable tool for any monitoring system.

Future Developments and Enhancements for Prometheus Histogram Count
Prometheus histogram count is a powerful tool for monitoring system performance, and it’s constantly being improved and enhanced. Here are some future developments and enhancements to look out for in Prometheus histogram count, and how they can be used to improve monitoring and system optimization in the future.
New Features
Prometheus histogram count is regularly updated with new features that improve its functionality and usability. For example, Prometheus recently added support for histograms with irregular buckets, which allows for more flexible and accurate monitoring of system performance. By staying up-to-date with the latest features in Prometheus histogram count, you can take advantage of these enhancements and improve your monitoring capabilities.
Improved Performance
Prometheus histogram count is also being improved for better performance. For example, Prometheus is working on optimizing its data storage and querying mechanisms to reduce query latency and improve overall system performance. By using these performance enhancements, you can ensure accurate and reliable monitoring with minimal impact on system resources.
Better Integration with Other Tools
Prometheus histogram count can be integrated with other monitoring tools (such as Grafana, Nagios, and Zabbix) to create a comprehensive monitoring system. To improve these integrations, Prometheus is working on better compatibility with other data formats (such as OpenTelemetry) and improved support for third-party plugins and integrations. By using these integration enhancements, you can create a seamless and comprehensive monitoring system that provides detailed insights into system performance.
By staying up-to-date with the latest developments and enhancements in Prometheus histogram count, you can take advantage of these improvements and optimize your monitoring and system optimization capabilities. With its powerful query language and integration capabilities, Prometheus histogram count is a valuable tool for any monitoring system.
Conclusion: The Benefits of Using Prometheus Histogram Count for Monitoring System Performance
Prometheus histogram count is a powerful tool for monitoring system performance, providing improved accuracy and more detailed insights into system behavior. By collecting data about the duration of requests or events, Prometheus histogram count can help identify bottlenecks, optimize system resources, and improve user experience.
Setting up Prometheus histogram count is a straightforward process, with clear benefits for system administrators and DevOps teams. By following best practices for setting appropriate buckets, monitoring histograms over time, and integrating histogram data with other monitoring tools, you can ensure accurate and reliable monitoring of system performance.
Compared to other monitoring tools such as Grafana, Nagios, and Zabbix, Prometheus histogram count offers unique advantages in terms of data collection and analysis. By combining Prometheus histogram count with these other tools, you can create a comprehensive monitoring system that provides detailed insights into system behavior.
Real-world use cases for Prometheus histogram count include monitoring web server response times, database query times, and API request times. By analyzing histogram data, you can identify performance issues, optimize system resources, and improve user experience.
When using Prometheus histogram count, it’s important to be aware of common issues such as misconfigured buckets, incorrect data collection, and integration issues with other tools. By following best practices and troubleshooting tips, you can ensure accurate and reliable monitoring of system performance.
Looking ahead, future developments and enhancements for Prometheus histogram count include new features, improved performance, and better integration with other tools. By staying up-to-date with these developments, you can continue to optimize your monitoring and system optimization capabilities.
In summary, Prometheus histogram count is a valuable tool for monitoring system performance, providing improved accuracy, more detailed insights, and better decision-making capabilities. By following best practices and staying up-to-date with the latest developments, you can ensure reliable and efficient system performance over time.