Understanding the Concept: What Does ‘Power Bi’ Signify?
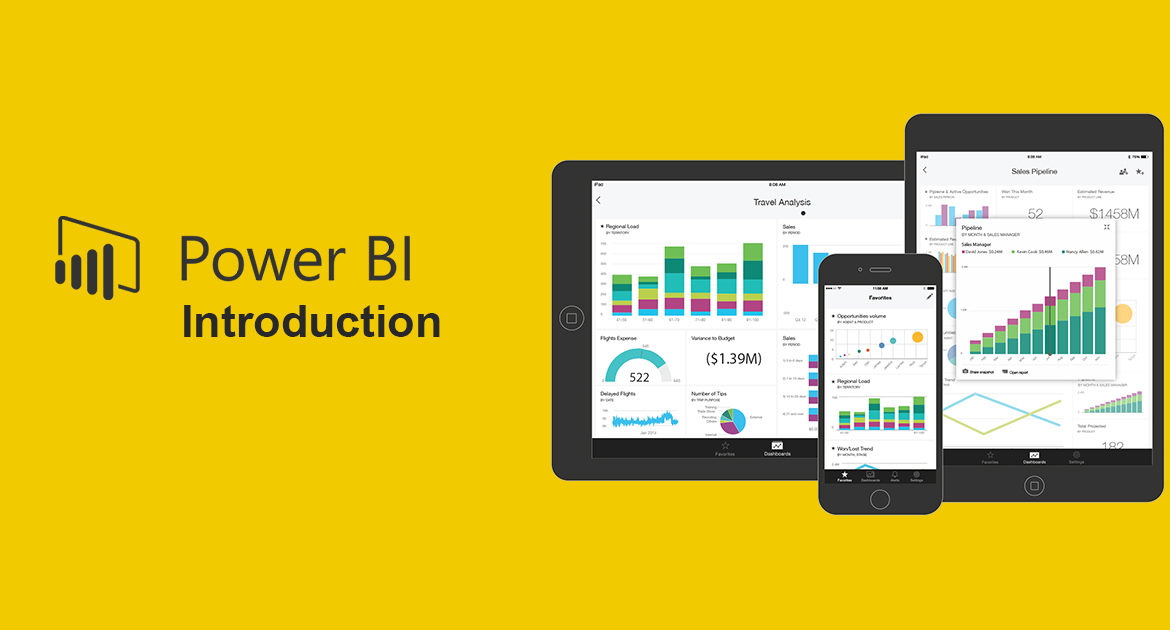
Power Bi, a term that has gained significant traction in the business intelligence (BI) landscape, refers to a collection of software services, apps, and connectors that work together to transform unrelated sources of data into coherent, visually immersive, and interactive insights. The primary goal of Power Bi is to provide organizations with a comprehensive BI solution that enables them to make informed decisions based on data.
At its core, Power Bi means empowering businesses with the ability to analyze and visualize data in a way that is easy to understand and interpret. The Power Bi ecosystem includes a wide range of features and capabilities, such as data visualization, data modeling, and report creation, that cater to the diverse needs of organizations. Power Bi can connect to various data sources, both on-premises and in the cloud, and allows users to create customized reports and dashboards that provide real-time insights into their business operations.
Power Bi is designed to be user-friendly and accessible to users with varying levels of technical expertise. The platform provides a drag-and-drop interface that enables users to create visualizations and reports without requiring extensive knowledge of coding or data analysis. Power Bi also offers pre-built templates and connectors that simplify the process of connecting to data sources and creating reports, making it an ideal solution for organizations that want to get started with BI quickly and easily.
In summary, Power Bi is a powerful BI tool that provides organizations with the ability to analyze and visualize data in a way that is easy to understand and interpret. By leveraging the features and capabilities of Power Bi, organizations can gain real-time insights into their business operations, make informed decisions, and ultimately, drive growth and success.
The Power Bi Ecosystem: A Wealth of Features and Capabilities
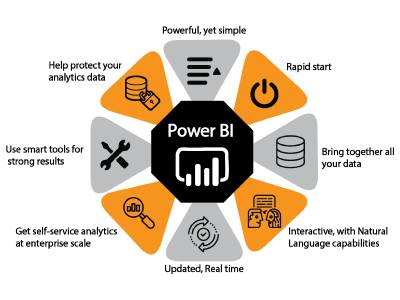
Power Bi is a robust and comprehensive BI tool that offers a wide range of features and capabilities to help organizations make data-driven decisions. One of the key strengths of Power Bi is its ability to connect to various data sources, both on-premises and in the cloud, and transform raw data into meaningful insights.
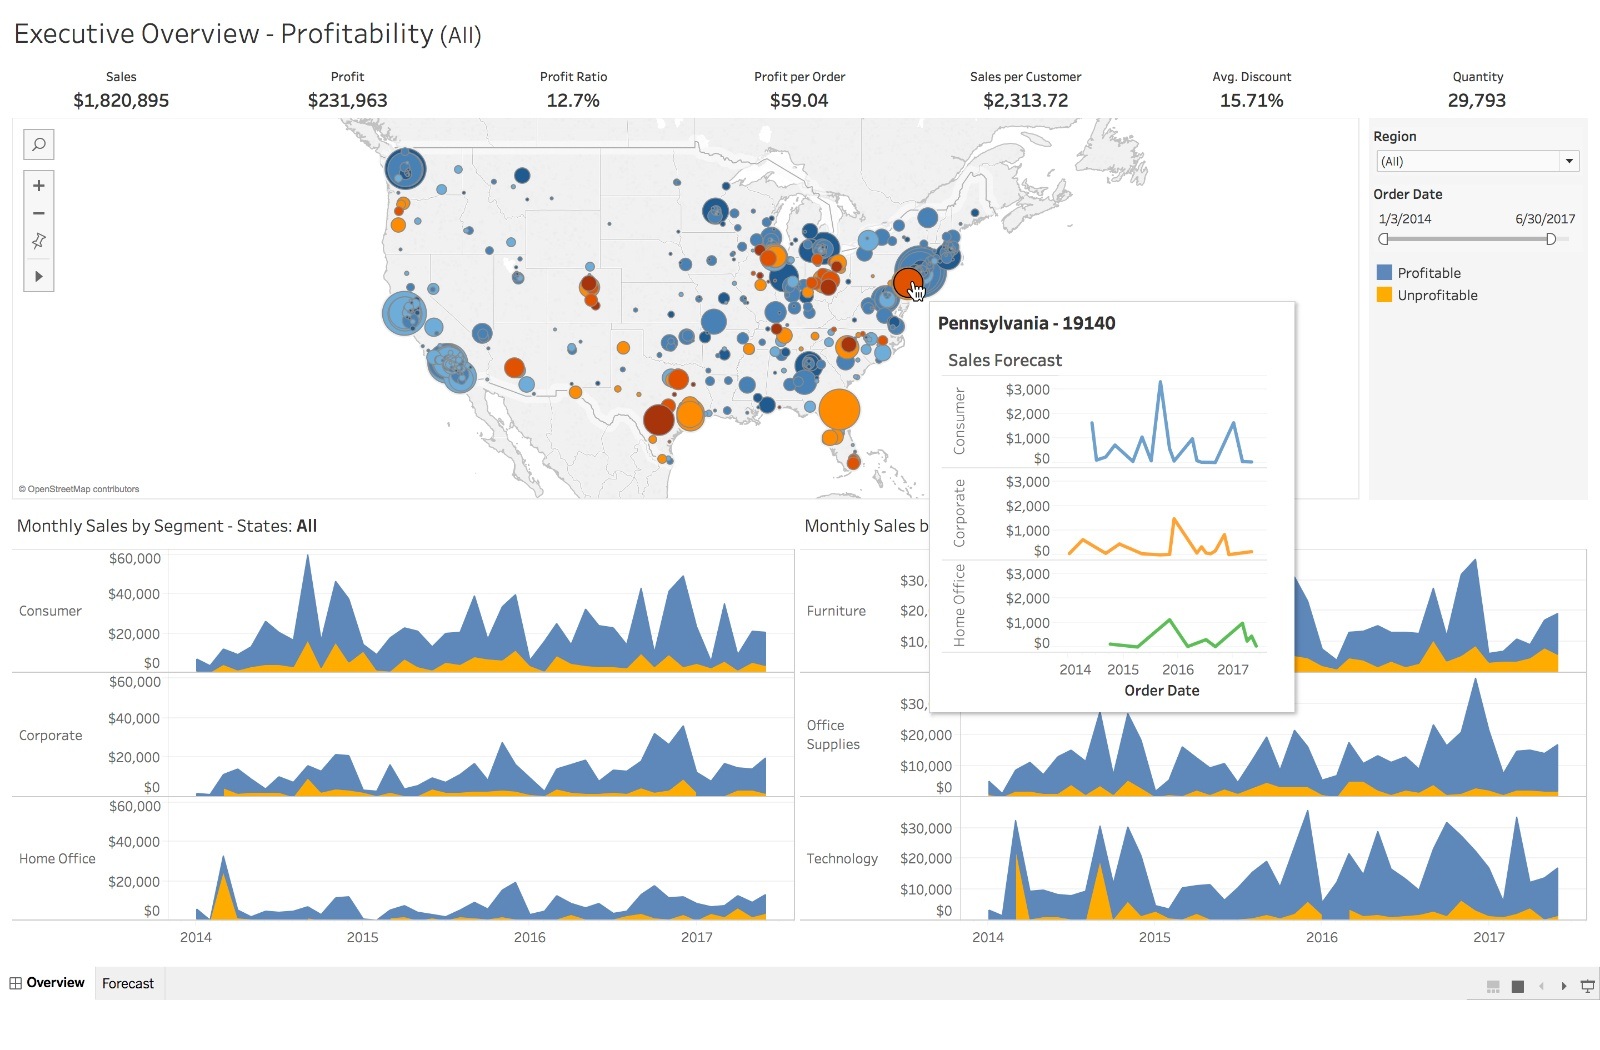
Data visualization is one of the core features of Power Bi. The platform provides a rich set of visualization tools that enable users to create interactive and visually appealing reports and dashboards. With Power Bi, users can create a variety of visualizations, including charts, graphs, maps, and tables, that help them better understand their data and identify trends and patterns. Power Bi also supports custom visualizations, allowing users to create their own visualizations using tools such as D3.js and Power Bi Visuals.
Data modeling is another key feature of Power Bi. The platform provides a powerful data modeling engine that enables users to create complex data models and perform advanced data analysis. Power Bi supports a wide range of data sources, including Excel, SQL Server, Oracle, and Salesforce, and allows users to combine data from multiple sources into a single data model. With Power Bi, users can perform advanced data analysis, such as time-intelligence calculations, aggregations, and forecasting, and create interactive reports and dashboards that provide real-time insights into their business operations.
Report creation is another area where Power Bi shines. The platform provides a user-friendly report authoring experience that enables users to create customized reports and dashboards without requiring extensive technical expertise. Power Bi supports a wide range of report formats, including paginated reports, mobile reports, and Power BI reports, and allows users to publish and share their reports with other users in their organization.
In summary, Power Bi is a powerful BI tool that offers a wide range of features and capabilities to help organizations make data-driven decisions. With its ability to connect to various data sources, data visualization tools, data modeling engine, and report creation capabilities, Power Bi provides users with the ability to transform raw data into meaningful insights and make informed decisions.
Power Bi Editions: Choosing the Right Option for Your Business
Power Bi offers a range of editions to meet the varying needs and budgets of organizations. Understanding the features and limitations of each edition is crucial in choosing the right option for your business.
Power Bi Free
Power Bi Free is the entry-level edition of Power Bi, and it is available at no cost. This edition is ideal for individual users or small teams who need basic data visualization and reporting capabilities. With Power Bi Free, users can connect to a limited number of data sources, create reports and dashboards, and share them with other users in their organization.
Power Bi Pro
Power Bi Pro is the premium edition of Power Bi, and it is designed for small to mid-sized businesses. This edition offers advanced data visualization and reporting capabilities, and it allows users to connect to a wide range of data sources, both on-premises and in the cloud. Power Bi Pro also supports collaboration and sharing features, enabling users to work together on reports and dashboards in real-time.
Power Bi Premium
Power Bi Premium is the enterprise-grade edition of Power Bi, and it is designed for large organizations with complex data needs. This edition offers advanced data modeling and analysis capabilities, and it allows users to create and deploy large-scale, enterprise-wide reports and dashboards. Power Bi Premium also supports dedicated capacity, which enables organizations to scale their Power Bi deployments and ensure high performance and reliability.
Choosing the right Power Bi edition depends on several factors, including the size of the organization, the complexity of the data needs, and the budget. For individual users or small teams, Power Bi Free may be sufficient. For small to mid-sized businesses, Power Bi Pro offers advanced features and capabilities. For large organizations with complex data needs, Power Bi Premium is the best option.
In summary, Power Bi offers a range of editions to meet the varying needs and budgets of organizations. Understanding the features and limitations of each edition is crucial in choosing the right option for your business. By selecting the right Power Bi edition, organizations can unlock the full potential of their data and make informed decisions based on insights and analytics.

How to Get Started with Power Bi: A Step-by-Step Guide
Getting started with Power Bi is a straightforward process that can be completed in a few simple steps. In this section, we will provide a step-by-step guide on how to get started with Power Bi, including creating an account, connecting to data sources, and creating reports and dashboards.
Step 1: Create a Power Bi Account
To get started with Power Bi, you need to create a Power Bi account. Visit the Power Bi website and click on the “Sign Up” button. Follow the prompts to create a new account. You can sign up for a free trial or choose one of the paid plans based on your needs.
Step 2: Connect to Data Sources
Once you have created a Power Bi account, the next step is to connect to your data sources. Power Bi supports a wide range of data sources, including Excel, SQL Server, Oracle, and Salesforce. To connect to a data source, click on the “Get Data” button in the Power Bi home screen and select the data source you want to connect to. Follow the prompts to enter your credentials and connect to the data source.
Step 3: Create Reports and Dashboards
After connecting to your data sources, the next step is to create reports and dashboards. Power Bi provides a user-friendly drag-and-drop interface that enables you to create customized reports and dashboards. To create a report, select the data you want to include in the report and use the visualization tools to create charts, graphs, and tables. You can also use the formatting tools to customize the look and feel of your report.
To create a dashboard, click on the “Dashboard” tab in the Power Bi home screen and select “New Dashboard.” Drag and drop the visualizations you want to include in the dashboard and resize them as needed. You can also add tiles, such as images and text, to provide additional context and insights.
Step 4: Share Reports and Dashboards
Once you have created your reports and dashboards, the next step is to share them with other users in your organization. Power Bi provides several sharing options, including email, links, and embedding. To share a report or dashboard, click on the “Share” button in the top right corner of the screen and select the sharing option you want to use.
In summary, getting started with Power Bi is a simple process that involves creating an account, connecting to data sources, creating reports and dashboards, and sharing them with other users. By following these steps, you can unlock the full potential of Power Bi and start making data-driven decisions based on insights and analytics.

Power Bi vs. Competitors: A Comparative Analysis
When it comes to business intelligence tools, Power Bi is one of the most popular options on the market. However, it is not the only option. In this section, we will compare Power Bi to its competitors, such as Tableau and QlikView, in terms of features, pricing, and user experience. We will provide an objective assessment of the strengths and weaknesses of each platform to help you make an informed decision.
Features
Power Bi, Tableau, and QlikView all offer similar features, such as data visualization, data modeling, and report creation. However, there are some differences in terms of functionality and capabilities. For example, Power Bi offers more advanced data modeling features, such as dataflows and composite models, while Tableau offers more advanced data visualization features, such as storytelling and advanced calculations.
Pricing
Pricing is another important consideration when choosing a business intelligence tool. Power Bi offers a range of pricing options, including a free version, a pro version, and a premium version. Tableau and QlikView also offer a range of pricing options, including a free version, a desktop version, and a server version. The pricing for each platform varies based on the features and capabilities offered.
User Experience
User experience is also an important consideration when choosing a business intelligence tool. Power Bi, Tableau, and QlikView all offer user-friendly interfaces that are easy to navigate. However, there are some differences in terms of the learning curve and the level of customization offered. For example, Power Bi offers more customization options, while Tableau offers a more intuitive interface.
Strengths and Weaknesses
Each platform has its own strengths and weaknesses. Power Bi is known for its advanced data modeling features, while Tableau is known for its advanced data visualization features. QlikView is known for its associative data model, which allows for more flexible and agile data analysis. It is important to consider your organization’s specific needs and requirements when choosing a business intelligence tool.
In summary, when comparing Power Bi to its competitors, it is important to consider the features, pricing, and user experience of each platform. While Power Bi, Tableau, and QlikView all offer similar capabilities, there are some differences in terms of functionality and capabilities. By understanding these differences, you can make an informed decision and choose the right business intelligence tool for your organization.
Real-World Applications of Power Bi: Success Stories and Case Studies
Power Bi has been implemented by organizations of all sizes and industries, from healthcare to finance to retail. In this section, we will share some success stories and case studies of organizations that have implemented Power Bi and reaped significant benefits. We will highlight the challenges they faced, the solutions they implemented, and the results they achieved.
Case Study 1: Healthcare Organization
A healthcare organization was facing challenges in managing and analyzing large volumes of patient data. They implemented Power Bi to create customized reports and dashboards that enabled them to visualize and analyze patient data in real-time. This helped them to identify trends and patterns, improve patient outcomes, and reduce costs.
Case Study 2: Finance Organization
A finance organization was looking for a business intelligence tool that could help them to analyze financial data and make data-driven decisions. They implemented Power Bi to create customized reports and dashboards that enabled them to visualize financial data in new and insightful ways. This helped them to identify areas for improvement, reduce risks, and increase profits.
Case Study 3: Retail Organization
A retail organization was facing challenges in managing and analyzing large volumes of sales data. They implemented Power Bi to create customized reports and dashboards that enabled them to visualize sales data in real-time. This helped them to identify trends and patterns, improve sales performance, and increase revenue.
In summary, these success stories and case studies demonstrate the real-world applications and benefits of Power Bi. By implementing Power Bi, organizations can turn unrelated sources of data into coherent, visually immersive, and interactive insights. This can help them to make data-driven decisions, improve performance, and achieve their business objectives.
Best Practices for Power Bi Implementation: Tips and Tricks
Implementing Power Bi in an organization can be a complex process, but by following best practices, you can ensure a successful deployment and maximize the value of the platform. In this section, we will offer tips and tricks for implementing Power Bi, including data governance, security, and training.
Data Governance
Data governance is an essential aspect of Power Bi implementation. It involves establishing policies and procedures for managing and using data in a way that is secure, accurate, and compliant. Here are some best practices for data governance in Power Bi:
- Define data ownership and accountability
- Establish data quality standards and processes
- Implement data security policies and procedures
- Create a data catalog and data lineage
Security
Security is another critical aspect of Power Bi implementation. It involves protecting data and infrastructure from unauthorized access, use, disclosure, disruption, modification, or destruction. Here are some best practices for security in Power Bi:
- Implement role-based access control
- Use encryption for data at rest and in transit
- Monitor and audit user activity
- Implement data loss prevention policies
Training
Training is essential for ensuring that users can effectively use Power Bi to meet their business needs. Here are some best practices for training in Power Bi:
- Provide user training on Power Bi features and capabilities
- Create user guides and tutorials
- Offer advanced training for power users
- Establish a support system for users
In summary, implementing Power Bi in an organization requires careful planning, execution, and management. By following best practices for data governance, security, and training, you can ensure a successful Power Bi deployment and maximize its value. With the right approach, Power Bi can help your organization turn unrelated sources of data into coherent, visually immersive, and interactive insights, enabling you to make data-driven decisions and achieve your business objectives.

The Future of Power Bi: Trends and Innovations
Power Bi is constantly evolving to meet the changing needs of businesses and users. In this section, we will discuss the future of Power Bi, including emerging trends and innovations, such as artificial intelligence, machine learning, and natural language processing. We will provide insights into how Power Bi is evolving to meet the needs of businesses and users, and how these trends and innovations can help organizations make better decisions and achieve their objectives.
Artificial Intelligence and Machine Learning
Artificial intelligence (AI) and machine learning (ML) are two of the most exciting and transformative technologies in business intelligence today. Power Bi is leveraging these technologies to provide users with more advanced analytics and insights. For example, Power Bi includes features such as automated machine learning, which enables users to build and deploy machine learning models without needing to write code. Power Bi also includes features such as natural language processing, which enables users to ask questions of their data using natural language queries.
Natural Language Processing
Natural language processing (NLP) is a technology that enables computers to understand and interpret human language. Power Bi includes features such as Q&A, which enables users to ask questions of their data using natural language queries. This makes it easier for users to explore their data and find insights, even if they don’t have a background in data analysis or statistics.
Data Storytelling
Data storytelling is the practice of using data to tell a story. Power Bi includes features such as Power Bi Stories, which enables users to create interactive, multimedia stories that combine data visualizations, text, and other multimedia elements. This makes it easier for users to communicate insights and ideas to stakeholders, even if they don’t have a background in data analysis or statistics.
Conclusion
Power Bi is a powerful business intelligence platform that is constantly evolving to meet the changing needs of businesses and users. By leveraging emerging trends and innovations, such as artificial intelligence, machine learning, and natural language processing, Power Bi is helping organizations make better decisions and achieve their objectives. Whether you’re just getting started with Power Bi or you’re a seasoned user, there’s always something new to learn and explore in this exciting and dynamic platform.